Navigating the CPU Usage Profiler module
The CPU Usage ProfilerA window that helps you to optimize your game. It shows how much time is spent in the various areas of your game. For example, it can report the percentage of time spent rendering, animating, or in your game logic. More info
See in Glossary module has some universal operations to make it easier to navigate between views.
Focus on a selected sample
To focus on a selected sample, press the F key. If you’ve selected nothing, this shows the default zoom level.
When you change to the Hierarchy, Raw Hierarchy or Inverted Hierarchy view, your selection carries over, as long as the sample is on the main thread. If you can’t immediately find the selection, press the F key to focus it.
Navigating and selecting items in Timeline view
To zoom in on areas of the Timeline view’s axis:
- Use the scroll wheel on your mouse, or
- Press and hold the Alt key while you drag with the right mouse button pressed down, or
- Use the ends of the horizontal scroll bar to zoom in.
- To pan the view, press the middle mouse button, or hold the Alt key (Command key on macOS) and press the left mouse button.
Press the A key on your keyboard to reset the zoom so that the entire frame time is visible.
The following options are available to manage the display of threads:
- To unfold a thread, click the white arrow on the bottom of a thread to display all lines
- To adjust the number of lines displayed, drag the line that separates the threads
- To set the height of the thread’s section to the maximum depth of the call stack, double-click the line.
- To collapse and expand groups of threads, click on the foldout arrows next to the thread names on the far left of the view.
Enable full call stacks
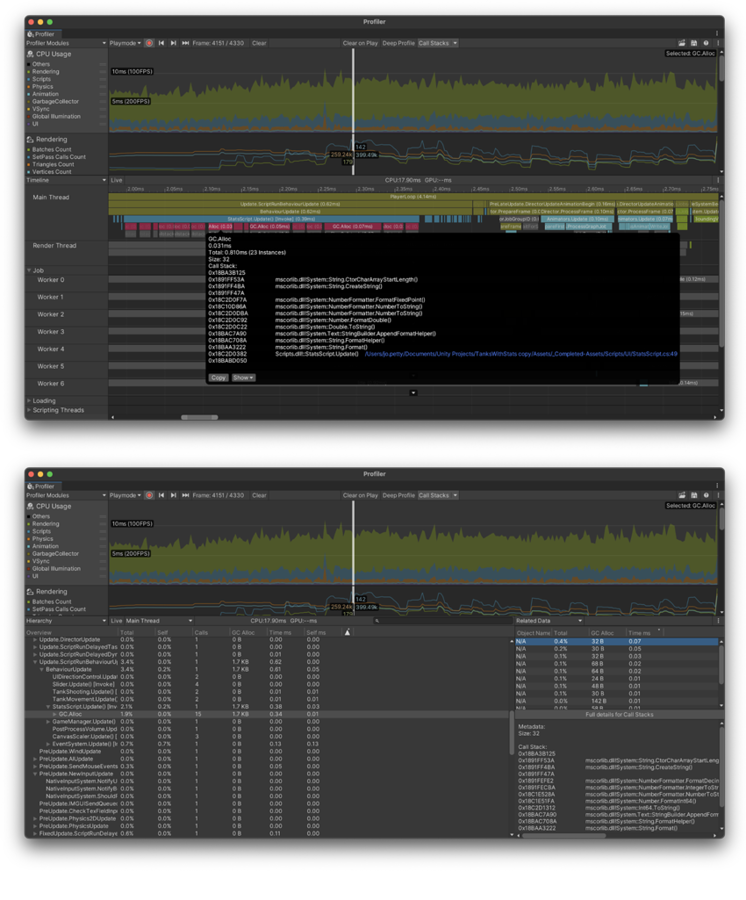
You can enable full call stacks for samples that GC.Alloc, UnsafeUtility.Malloc, and JobHandle.Complete emit. To enable these call stacks:
- Enable the Call Stacks button in the Profiler’s toolbarA row of buttons and basic controls at the top of the Unity Editor that allows you to interact with the Editor in various ways (e.g. scaling, translation). More info
See in Glossary. By default, this enables the call stacks forGC.Allocsamples. - To enable other call stacks, select the dropdown arrow and enable any of the other markers you want to display the call stacks for.
You can use this functionality whether you profile in the Unity Editor or on a running player. This only takes effect for the frames you profile after you enable this setting.
To investigate call stacks further:
- Select a sample in the Timeline view
- To copy the call stack, select Copy
- To open the relevant code file, select the file path (highlighted as a blue link). Note: Not all code files are available in this way. Also, the call stack information doesn’t contain the exact line number within that method but just the line at the beginning of that method.
To open the full call stack details:
- Open the sample in the Hierarchy or Raw Hierarchy view.
- Set the Details view to Related Data.
The Related Data view lists the metadata associated with this sample, which might include a UnityEngine.Object that it was associated with. For any metadata entry that isn’t associated with a UnityEngine.Object, the name displays as N/A in this panel. When you select an N/A entry, the Profiler displays the meta data, including the call stack in the bottom half of the details view.
Some samples that Unity reports has metadata built in, such as Camera.Render samples linked to the Camera GameObjectThe fundamental object in Unity scenes, which can represent characters, props, scenery, cameras, waypoints, and more. A GameObject’s functionality is defined by the Components attached to it. More info
See in Glossary that does the rendering. Unity reports these objects via their instance ID and resolves them to a name in the Profiler window, if you profile in Play mode. When you click on one of these objects, Unity tries to find the object via the SceneA Scene contains the environments and menus of your game. Think of each unique Scene file as a unique level. In each Scene, you place your environments, obstacles, and decorations, essentially designing and building your game in pieces. More info
See in Glossary hierarchy and ping it.
Because the association uses the instance ID, pinging only works when you profile your application in Play mode, and for as long as the object still exists. For GC.Alloc samples, this view displays a list of N/A items, one for each allocation that happened at this hierarchy level, with the size of the allocation listed in the GC.Alloc column.

For more information about these markers, refer to the documentation on Profiler MarkersPlaced in code to describe a CPU or GPU event that is then displayed in the Unity Profiler window. Added to Unity code by default, or you can use ProfilerMarker API to add your own custom markers. More info
See in Glossary.