Troubleshooting the Frame Time Manager
For GPUs that use tile-based deferred rendering architecture, such as Metal GPUs in Apple devices, the reported GPU Time might be larger than the reported frame time.
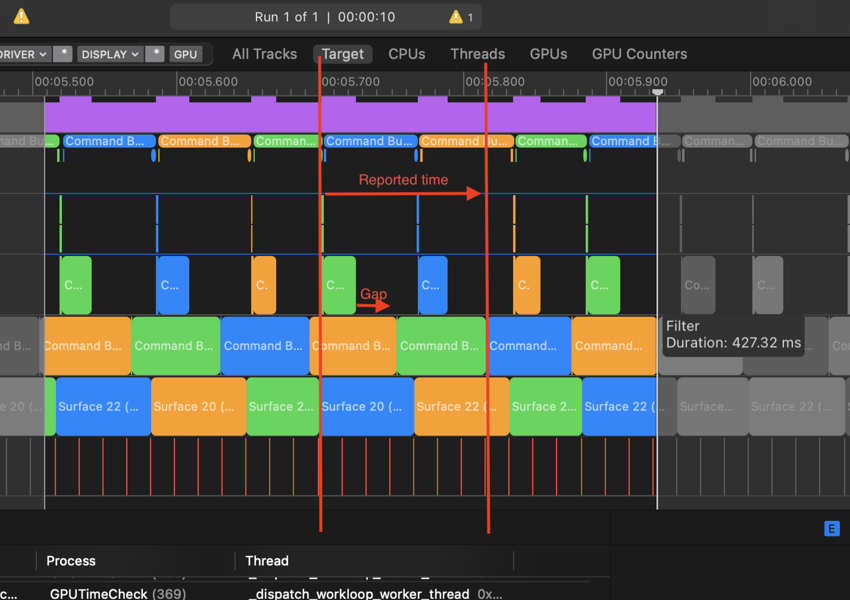
This can happen when the GPU is under heavy load, or when the GPU pipeline is full. In these cases, the GPU might defer execution of some rendering phases. Because the FrameTimingManager measures the time between the beginning and end of the frame rendering, any gaps between phases increase the reported GPU time.
In the example below, no GPU resources are available, because the GPU passes a job from the Vertex queue to the Fragment queue. The GPU’s graphics API therefore defers the execution of the next phase. When this happens, the GPU time measurement includes phase work time and any gap in between. The result is that the FrameTimingManager reports a higher GPU time measurement than expected.
