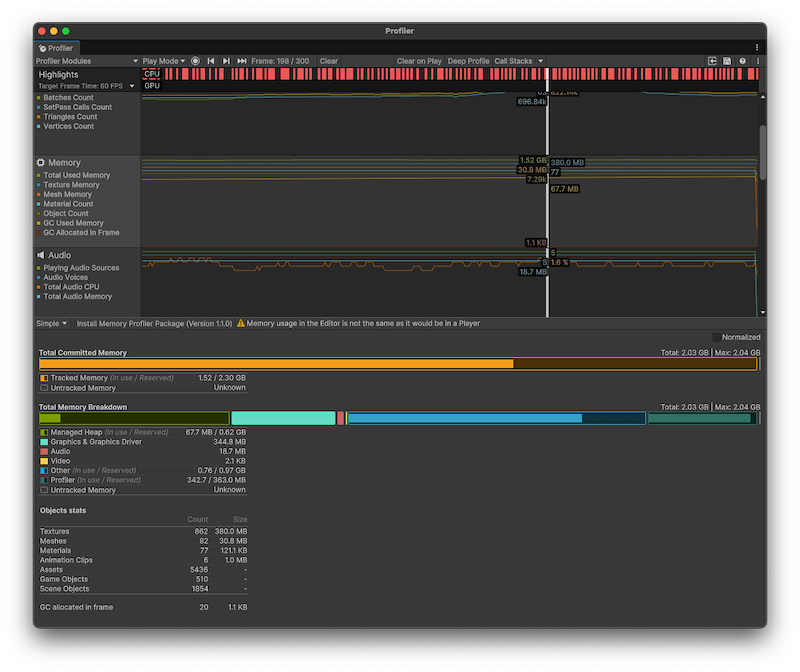
Memory Profiler module introduction
The Memory ProfilerA window that helps you to optimize your game. It shows how much time is spent in the various areas of your game. For example, it can report the percentage of time spent rendering, animating, or in your game logic. More info
See in Glossary module visualizes counters that represent the total allocated memory in your application. You can use the memory module to visualize where Unity allocated memory, and in what categories it spent memory.
The built-in Memory Profiler module displays a basic overview of memory allocations in your application.

To view a detailed breakdown of memory usage in your application, use the Memory Profiler package. The package adds an additional Memory Profiler window to the Unity Editor, which you can then use to analyze memory usage in your application in more detail than the Memory Profiler module. You can store and compare snapshots to find memory leaks, or view the memory layout to find memory fragmentation issues. For more information about the Memory Profiler package, refer to the Memory Profiler package documentation.
Memory profiling in the Unity Editor
When you profile your application in Play mode, the Memory Profiler module reports higher data use than a similar profile of the application built on a target device. This is because the Unity Editor uses specific objects that take up memory, and the Editor window itself uses extra memory.
Part of the extra memory use is because Unity treats objects like textures as read/write enabled in the Editor and keeps an extra copy of each texture on the CPU. This effectively doubles the reported memory use of textures in the Editor. For a more accurate idea of memory use by textures, profile a built version of your application running on the target platform.
Unity can’t cleanly separate the memory that the Profiler itself takes up from the Play mode’s memory, so memory that the Profiler process uses is also displayed in the Profiler window.
To remind you of this, a warning displays at the top of the Memory Profiler module details pane whenever you have the Profiler target set to Play mode or Editor. For more precise numbers and memory usage for your application, profile your application on the target device and operating system you intend it to run on. For more information, refer to Profiling your application.