Troubleshooting en dispositivos iOS
Hay algunas situaciones con iOS donde su juego puede funcionar perfectamente en el Editor de Unity pero no funciona o, ni siquiera comienza en el dispositivo actual. Los problemas a menudos están relacionados al código o la calidad de contenido. Esta sección describe los escenarios más comunes.
El juego para de responder después de un poco. Xcode muestra “interrupted” en la barra de estado.
Hay un número de razones de por qué esto puede suceder. Las causas típicas incluyen:
- Errores de Scripting como el uso de variables no inicializadas, etc.
- Utilizar librerías de nativas compiladas de terceros. Tales librerías activa un problema conocido en el linker del SDK de iOS y puede causar problemas(crashes) aleatorios.
- Utilizar tipos génericos con tipos de valores como parámetros (eg List<int>, List<SomeStruct>, List<SomeEnum>, etc) para propiedades de script serializables.
- Utilizar reflexión cuando managed code stripping esté activado.
- Errores en la intefaz de plugin nativa (el método para manejar código signature no concuerda con la función de código nativo signature). Información de la consola XCode Debugger puede a veces ayudar detectar estos problemas (Menú de Xcode: View > Debug Area > Activate Console).
La consola de Xcode muestra "Program received signal: “SIGBUS” o EXC_BAD_ACCESS error.
Este mensaje típicamente aparece en dispositivos iOS cuando su aplicación recibe una NullReferenceException. Hay dos maneras para descifrar dónde ocurrió la falta:
Administrar los seguimientos de pila (Managed Stack Traces)
Desde la versión 3.4 Unity incluye un manejo de software de la NullReferenceException. El compilador AOT incluye una revisión rápida de referencias nulas cada vez que un método o variable sea accedida en un objeto. Esta característica afecta el rendimiento del script por lo cual está activada solamente para las construcciones de desarrollo (para usuarios de licencia básica solamente es suficiente activa la opción “development build” en el dialogo de las Build Settings, mientras los usuarios de licencia pro adicionalmente necesitan activar la opción “script debugging” ). Si todo fue hecho de manera correcta, y la falla está ocurriendo en el código .NET entonces usted no verá EXC_BAD_ACCESS más. Más bien, el texto de la excepción .NET será imprimida en la consola de Xcode (o su código solo lo manejará en una declaración “catch”). El output típico puede ser:
Unhandled Exception: System.NullReferenceException: A null value was found where an object instance was required.
  at DayController+$handleTimeOfDay$121+$.MoveNext () [0x0035a] in DayController.js:122
Esto indica que la falla ocurrió en el método handleTimeOfDay de la clase DayController, que funciona como una coroutine. También si es código script entonces a usted se le dirá por lo genera el número de la linea exacta (eg, “DayController.js:122”). La linea que causa los problemas puede ser como la siguiente:
Instantiate(_imgwww.assetBundle.mainAsset);
Esto puede suceder si, digamos, el script accede un asset bundle sin primero revisar que fuera descargado correctamente.
Seguimientos de pila nativos (Native stack traces)
Los seguimientos de pila nativos (Native stack traces) son una herramienta más poderosa para la investigación de fallas pero utilizarlas requiere de algún conocimiento avanzado. También, usted por lo general no puede continuar después de que estas fallas nativas (hardware memory access) ocurran. Para obtener un seguimiento de pila nativo, escriba bt all a la Consola de Xcode debugger. Cuidadosamente inspeccione los seguimientos de pila impresos - estos pueden contener pistas acerca de dónde el error ocurrió. Usted podría ver algo como:
...
Thread 1 (thread 11523):

1. 0 0x006267d0 in m_OptionsMenu_Start ()
1. 1 0x002e4160 in wrapper_runtime_invoke_object_runtime_invoke_void__this___object_intptr_intptr_intptr ()
1. 2 0x00a1dd64 in mono_jit_runtime_invoke (method=0x18b63bc, obj=0x5d10cb0, params=0x0, exc=0x2fffdd34) at /Users/mantasp/work/unity/unity-mono/External/Mono/mono/mono/mini/mini.c:4487
1. 3 0x0088481c in MonoBehaviour::InvokeMethodOrCoroutineChecked ()
...
Primero que todo, usted debería encontrar el seguimiento de pila para “Thread 1”, el cual es el hilo principal. Las primeras lineas del seguimiento de pila van a apuntar al lugar dónde el error ocurrió. En este ejemplo, el seguimiento indico que la NullReferenceException sucedio dentro el “OptionsMenu” del método “Start” del script. Mirando de manera cuidadosa a la implementación de este método va a mostrar la causa del problema. Típicamente, la NullReferenceExceptions sucede dentro del método Start cuando asunciones incorrectas son hechas acerca del orden de inicialización. En algunos casos solo un seguimiento de pila parcial es visto en la Consola Debugger:
Thread 1 (thread 11523):

1. 0 0x0062564c in start ()
Esto indica que los símbolos nativos fueron stripped durante la construcción final de la aplicación. El seguimiento de pila completo puede ser obtenido con los siguiente procedimientos:
- Quite la aplicación del dispositivo.
- Limpie todos los objetivos (targets)
- Construya y corra.
- Obtenga los seguimiento de pila nuevamente como es descrito arriba.
EXC_BAD_ACCESS comienza ocurriendo cuando una librería externa está vinculada a la aplicación de Unity iOS.
Esto por lo general ocurre cuando una librería externa es compilada con el conjunto de instrucciones Thumb de ARM. Actualmente tales librerías no son compatibles con Unity. El problema puede ser resuelto fácilmente re-compilando la librería sin las instrucciones Thumb. Usted puede hacer esto para el proyecto Xcode de la librería con los siguientes pasos:
- en Xcode, seleccione “View” > “Navigators” > “Show Project Navigator” desde el menú.
- Seleccione el proyecto “Unity-iPhone”, active la pestaña “Build Settings”
- en el campo de búsqueda escriba: “Other C Flags”
- Agregue -mno-thumb flag ahí y re-construya la librería.
Si la fuente de la librería no está disponible, usted debería preguntarle al proveedor por una versión sin-thumb de la librería.
La consola de Xcode muestra “WARNING -> applicationDidReceiveMemoryWarning()” y la aplicación cae inmediatamente después
(algunas veces usted podría ver un mensaje como Program received signal: “0”.) Este mensaje de advertencia a menudo no es fatal y a penas indica que el iOS está bajo en memoria y está preguntando por aplicaciones para liberar alguna memoria. Típicamente, los procesos del fondo como el Correo van a liberar alguna memoria y su aplicación puede continuar corriendo. Sin embargo, si su aplicación continua utilizando memoria o pregunta para más, el OS va a eventualmente comenzar a destruir aplicaciones y la suya puede ser una de ellas. Apple no documenta qué uso de memoria es segura, pero observaciones empíricas muestra que aplicaciones utilizando mensos que el 50% MB de toda la RAM del dispositivo (aproximadamente 200–256 MB para la segunda generación de ipad) no tienen problema mayores de uso de memoria. The main metric you should rely on is how much RAM your application uses. Your application memory usage consists of three major components:
- application code (the OS needs to load and keep your application code in RAM, but some of it might be discarded if really needed)
- native heap (used by the engine to store its state, your assets, etc. in RAM)
- managed heap (used by your Mono runtime to keep C# or JavaScript objects)
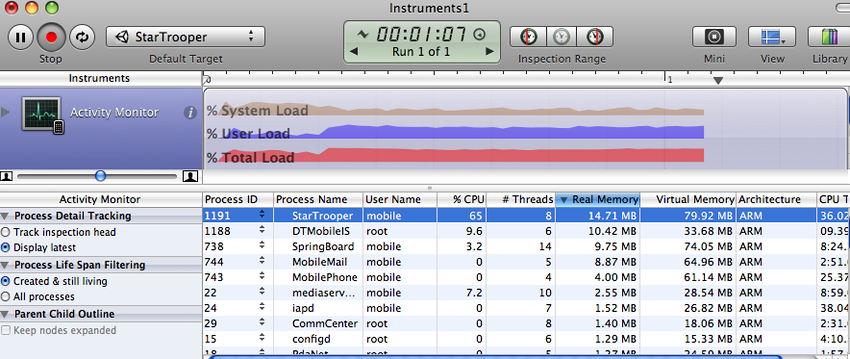
- GLES driver memory pools: textures, framebuffers, compiled shaders, etc. Your application memory usage can be tracked by two Xcode Instruments tools: Activity Monitor, Object Allocations and VM Tracker. You can start from the Xcode Run menu: Product > Profile and then select specific tool. Activity Monitor tool shows all process statistics including Real memory which can be regarded as the total amount of RAM used by your application. Note: OS and device HW version combination might noticeably affect memory usage numbers, so you should be careful when comparing numbers obtained on different devices.
Note: The internal profiler shows only the heap allocated by .NET scripts. Total memory usage can be determined via Xcode Instruments as shown above. This figure includes parts of the application binary, some standard framework buffers, Unity engine internal state buffers, the .NET runtime heap (number printed by internal profiler), GLES driver heap and some other miscellaneous stuff.
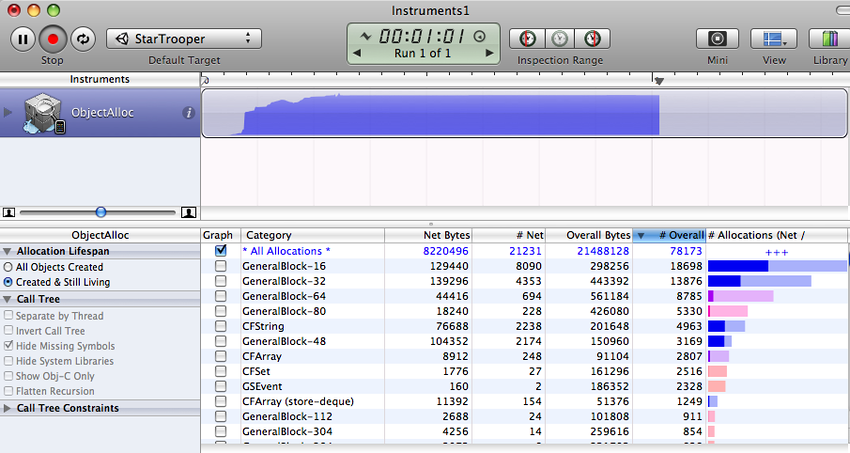
The other tool displays all allocations made by your application and includes both native heap and managed heap statistics (don’t forget to check the Created and still living box to get the current state of the application). The important statistic is the Net bytes value.
To keep memory usage low:
- Reduce the application binary size by using the strongest iOS stripping options, and avoid unnecessary dependencies on different .NET libraries. See the player settings and player size optimization manual pages for further details.
- Reduce the size of your content. Use PVRTC compression for textures and use low poly models. See the manual page about reducing file size for more information.
- Don’t allocate more memory than necessary in your scripts. Track mono heap size and usage with the internal profiler
- Note: with Unity 3.0, the scene loading implementation has changed significantly and now all scene assets are preloaded. This results in fewer hiccups when instantiating game objects. If you need more fine-grained control of asset loading and unloading during gameplay, you should use Resources.Load and Object.Destroy.
Querying the OS about the amount of free memory may seem like a good idea to evaluate how well your application is performing. However, the free memory statistic is likely to be unreliable since the OS uses a lot of dynamic buffers and caches. The only reliable approach is to keep track of memory consumption for your application and use that as the main metric. Pay attention to how the graphs from the tools described above change over time, especially after loading new levels.
The game runs correctly when launched from Xcode but crashes while loading the first level when launched manually on the device.
There could be several reasons for this. You need to inspect the device logs to get more details. Connect the device to your Mac, launch Xcode and select Window > Organizer from the menu. Select your device in the Organizer’s left toolbar, then click on the “Console” tab and review the latest messages carefully. Additionally, you may need to investigate crash reports. You can find out how to obtain crash reports here: http://developer.apple.com/iphone/library/technotes/tn2008/tn2151.html.
The Xcode Organizer console contains the message “killed by SpringBoard”.
There is a poorly-documented time limit for an iOS application to render its first frames and process input. If your application exceeds this limit, it will be killed by SpringBoard. This may happen in an application with a first scene which is too large, for example. To avoid this problem, it is advisable to create a small initial scene which just displays a splash screen, waits a frame or two with yield and then starts loading the real scene. This can be done with code as simple as the following:
function Start() {
    yield;
    Application.LoadLevel("Test");
}
Type.GetProperty() / Type.GetValue() cause crashes on the device
Currently Type.GetProperty() and Type.GetValue() are supported only for the .NET 2.0 Subset profile. You can select the .NET API compatibility level in the Player Settings.
Note: Type.GetProperty() and Type.GetValue() might be incompatible with managed code stripping and might need to be excluded (you can supply a custom non-strippable type list during the stripping process to accomplish this). For further details, see the iOS player size optimization guide.
The game crashes with the error message “ExecutionEngineException: Attempting to JIT compile method ‘SometType`1<SomeValueType>:.ctor ()’ while running with –aot-only.”
The Mono .NET implementation for iOS is based on AOT (ahead of time compilation to native code) technology, which has its limitations. It compiles only those generic type methods (where a value type is used as a generic parameter) which are explicitly used by other code. When such methods are used only via reflection or from native code (ie, the serialization system) then they get skipped during AOT compilation. The AOT compiler can be hinted to include code by adding a dummy method somewhere in the script code. This can refer to the missing methods and so get them compiled ahead of time.
void _unusedMethod() {
    var tmp = new SomeType<SomeValueType>();
}
Note: value types are basic types, enums and structs.
Various crashes occur on the device when a combination of System.Security.Cryptography and managed code stripping is used
.NET Cryptography services rely heavily on reflection and so are not compatible with managed code stripping since this involves static code analysis. Sometimes the easiest solution to the crashes is to exclude the whole System.Security.Crypography namespace from the stripping process.
The stripping process can be customized by adding a custom link.xml file to the Assets folder of your Unity project. This specifies which types and namespaces should be excluded from stripping. Further details can be found in the iOS player size optimization guide.
link.xml
<linker>
       <assembly fullname="mscorlib">
               <namespace fullname="System.Security.Cryptography" preserve="all"/>
       </assembly>
</linker>
Application crashes when using System.Security.Cryptography.MD5 with managed code stripping
You might consider advice listed above or can work around this problem by adding extra reference to specific class to your script code:
object obj = new MD5CryptoServiceProvider();
“Ran out of trampolines of type 0/1/2” runtime error
This error usually happens if you use lots of recursive generics. You can hint to the AOT compiler to allocate more trampolines of type 0, type 1 or type 2. Additional AOT compiler command line options can be specified in the “Other Settings” section of the Player Settings. For type 1 trampolines, specify nrgctx-trampolines=ABCD, where ABCD is the number of new trampolines required (i.e. 4096). For type 2 trampolines specify nimt-trampolines=ABCD and for type 0 trampolines specify ntrampolines=ABCD.
After upgrading Xcode Unity iOS runtime fails with message “You are using Unity iPhone Basic. You are not allowed to remove the Unity splash screen from your game”
With some latest Xcode releases there were changes introduced in PNG compression and optimization tool. These changes might cause false positives in Unity iOS runtime checks for splash screen modifications. If you encounter such problems try upgrading Unity to the latest publicly available version. If it does not help you might consider following workaround:
Replace your Xcode project from scratch when building from Unity (instead of appending it)
Borre el proyecto ya instalado del dispositivo
Clean el proyecto en Xcode (Product->Clean)
Clear Xcode’s Derived Data folders (Xcode->Preferences->Locations) If this still does not help try disabling PNG re-compression in Xcode:
Abra su proyecto de Xcode
Seleccione el proyecto “Unity-iPhone” ahí
Seleccione la pestaña “Build Settings” ahí
Busque por la opción “Compress PNG files” y configure esto a NO
App Store submission fails with “iPhone/iPod Touch: application executable is missing a required architecture. At least one of the following architecture(s) must be present: armv6” message
You might get such message when updating already existing application, which previously was submitted with armv6 support. Unity 4.x and Xcode 4.5 does not support armv6 platform anymore. To solve submission problem just set Target OS Version in Unity Player Settings to 4.3 or higher.
WWW downloads are working fine in Unity Editor and on Android, but not on iOS
Most common mistake is to assume that WWW downloads are always happening on separate thread. On some platforms this might be true, but you should not take it for granted. Best way to track WWW status is either to use yield statement or check status in Update method. You should not use busy while loops for that.
“PlayerLoop called recursively!” error occurs when using Cocoa via a native function called from a script
Some operations with the UI will result in iOS redrawing the window immediately (the most common example is adding a UIView with a UIViewController to the main UIWindow). If you call a native function from a script, it will happen inside Unity’s PlayerLoop, resulting in PlayerLoop being called recursively. In such cases, you should consider using the performSelectorOnMainThread method with waitUntilDone set to false. It will inform iOS to schedule the operation to run between Unity’s PlayerLoop calls.
Profiler or Debugger unable to see game running on iOS device
- Check that you have built a Development build, and ticked the “Enable Script Debugging” and “Autoconnect profiler” boxes (as appropriate).
- The application running on the device will make a multicast broadcast to 225.0.0.222 on UDP port 54997. Check that your network settings allow this traffic. Then, the profiler will make a connection to the remote device on a port in the range 55000 - 55511 to fetch profiler data from the device. These ports will need to be open for UDP access.
DLLs faltantes
If your application runs ok in editor but you get errors in your iOS project this may be caused by missing DLLs (e.g. I18N.dll, I19N.West.dll). In this case, try copying those dlls from within the Unity.app to your project’s Assets/Plugins folder. The location of the DLLs within the unity app is: Unity.app/Contents/Frameworks/Mono/lib/mono/unity You should then also check the stripping level of your project to ensure the classes in the DLLs aren’t being removed when the build is optimised. Refer to the iOS Optimisation Page for more information on iOS Stripping Levels.
Xcode Debugger console reports: ExecutionEngineException: Attempting to JIT compile method ‘(wrapper native-to-managed) Test:TestFunc (int)’ while running with –aot-only
Typically such message is received when managed function delegate is passed to the native function, but required wrapper code wasn’t generated when building application. You can help AOT compiler by hinting which methods will be passed as delegates to the native code. This can be done by adding “MonoPInvokeCallbackAttribute” custom attribute. Currently only static methods can be passed as delegates to the native code.
Código ejemplo:
using UnityEngine;
using System.Collections;
using System;
using System.Runtime.InteropServices;
using AOT;

public class NewBehaviourScript : MonoBehaviour {
    [DllImport ("__Internal")]
    private static extern void DoSomething (NoParamDelegate del1, StringParamDelegate del2);

    delegate void NoParamDelegate ();
    delegate void StringParamDelegate (string str);

    [MonoPInvokeCallback(typeof(NoParamDelegate))]
    public static void NoParamCallback() {
        Debug.Log ("Hello from NoParamCallback");
    }

    [MonoPInvokeCallback(typeof(StringParamDelegate))]
    public static void StringParamCallback(string str) {
        Debug.Log(string.Format("Hello from StringParamCallback {0}", str));
    }

    // Use this for initialization
    void Start() {
        DoSomething(NoParamCallback, StringParamCallback);
    }
}
Xcode throws compilation error: “ld : unable to insert branch island. No insertion point available. for architecture armv7”, “clang: error: linker command failed with exit code 1 (use -v to see invocation)”
That error usually means there is just too much code in single module. Typically it is caused by having lots of script code or having big external .NET assemblies included into build. And enabling script debugging might make things worse, because it adds quite few additional instructions to each function, so it is easier to hit that limit.
Enabling managed code stripping in player settings might help with this problem, especially if big external .NET assemblies are involved. But if the issue persists then the best solution is to split user script code into multiple assemblies. The easiest way to this is move some code to Plugins folder. Code at this location is put to different assembly. Also check the information about how special folder names affect script compilation: