UI Toolkit Debugger
The UI(User Interface) Allows a user to interact with your application. Unity currently supports three UI systems. More info
See in Glossary Toolkit Debugger is a tool that you can use to inspect and debug your UI elements in real-time. It provides a visual representation of your UI hierarchy. You use it to examine the state and properties of each UI element.
When you open the UI Toolkit Debugger, it displays a window that shows a live view of your UI hierarchy. You can select any element in the hierarchy to inspect its properties and state. The debugger also displays any errors or warnings related to your UI elements.
One of the key features of the UI Toolkit Debugger is the ability to view and edit the styles that are applied to your UI elements. This is done through the Style InspectorA Unity window that displays information about the currently selected GameObject, asset or project settings, allowing you to inspect and edit the values. More info
See in Glossary, which allows you to see all the style properties that are applied to a particular element. You can also edit these properties in real-time to see the effect they have on your UI.
Note: Editing styles in the Debugger only changes the inline styles on the live elements themselves and the changes aren’t saved anywhere and will be lost on the next UI regeneration.
To use the UI Toolkit Debugger:
Select Window > UI Toolkit > Debugger to open the UI Toolkit Debugger window.
-
Do the following:
- To debug elements in UI Builder, in the ViewportThe user’s visible area of an app on their screen.
See in Glossary window of the UI Builder, click Preview to enable the Preview mode. Preview mode turns off the invisible elements in the Canvas. Those invisible elements absorb all mouse events and are used to pick elements for editing. UI Toolkit Debugger will pick them instead of your actual elements if they’re not turned off. - To debug elements in the sceneA Scene contains the environments and menus of your game. Think of each unique Scene file as a unique level. In each Scene, you place your environments, obstacles, and decorations, essentially designing and building your game in pieces. More info
See in Glossary view, select the GameObjectThe fundamental object in Unity scenes, which can represent characters, props, scenery, cameras, waypoints, and more. A GameObject’s functionality is defined by the Components attached to it. Glossary view, select the GameObjectThe fundamental object in Unity scenes, which can represent characters, props, scenery, cameras, waypoints, and more. A GameObject’s functionality is defined by the Components attached to it. More info
See in Glossary and enter Play mode.
- To debug elements in UI Builder, in the ViewportThe user’s visible area of an app on their screen.
In the UI Toolkit Debugger window, select Pick Element.
-
In the Canvas of the UI Builder or in the Game view, select the element that you want to debug. The UI Toolkit Debugger window shows a live view of your UI hierarchy and displays the following:
- All child elements of the
VisualElement - All USS selectors for each component of the
VisualElement - Detailed information for each USS selector
- All child elements of the
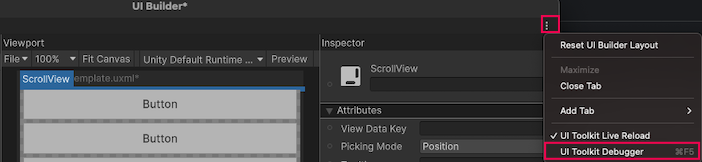
Tip: You can also open the UI Toolkit Debugger window by clicking ⋮ in the UI Builder or the Game view, and then selecting UI Toolkit Debugger.