可视化性能分析器计数器
将性能分析器计数器添加到代码后,就可以在性能分析器窗口或应用程序的构建中对其可视化。
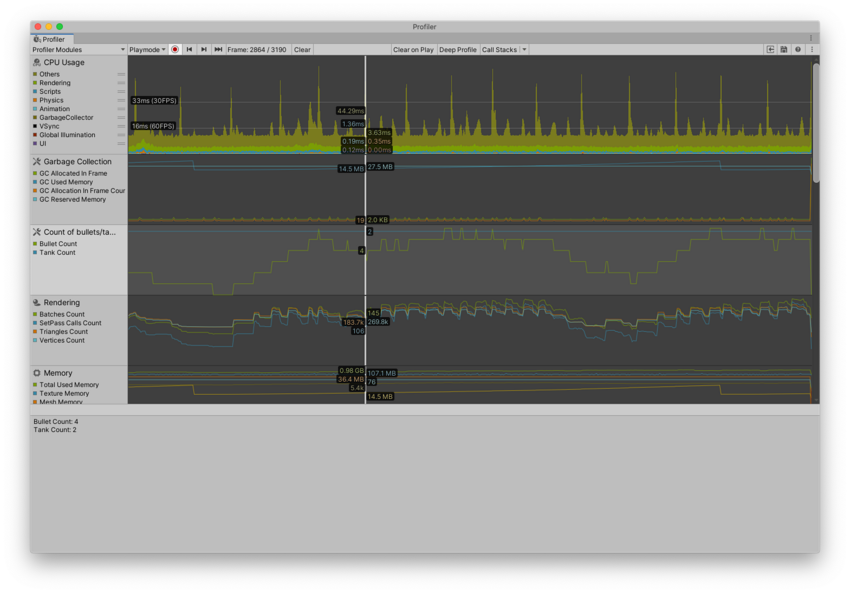
在性能分析器窗口中可视化自定义计数器
要查看 ProfilerCounter 或 ProfilerCounterValue 在性能分析器窗口中生成的数据,可以使用自定义性能分析器模块。这可能有助于直观地识别与其他系统指标的关系并快速找出性能问题。
向代码中添加指标
以下示例假设 GameManager 类负责处理高层次逻辑,并且能感知敌人相关信息。要更新计数器的值,可在 Update 或 LateUpdate 方法中(具体取决于生成或销毁敌人的逻辑何时执行),使用 Sample 方法将敌人的计数值推送到性能分析器:
using UnityEngine;
using Unity.Profiling;

class GameManager : MonoBehaviour
{
    Enemy[] m_Enemies;

    void Update()
    {
        GameStats.EnemyCount.Sample(m_Enemies.Length);
    }
}
为了将子弹数量传递给性能分析器,此示例假定有一个处理子弹生命周期的脚本。然后,它会在 Awake 中增加 GameStats.BulletCount 的值,并在 OnDestroy 中减少该值,以此来准确反映游戏中当前子弹的流动情况。
using UnityEngine;
using Unity.Profiling;

public class Shell : MonoBehaviour
{
    void Awake()
    {
        GameStats.BulletCount.Value += 1;
    }
    void OnDestroy()
    {
        GameStats.BulletCount.Value -= 1;
    }
}
注意:在非开发版本的构建中,Unity 会编译排除 ProfilerCounter 和 ProfilerCounterValue。
将自定义模块添加到性能分析器窗口
使用性能分析器模块编辑器 (Profiler Module Editor) 以选择内置的或新添加的计数器进行可视化显示。如要打开性能分析器模块编辑器:
- 打开性能分析器窗口(窗口 (Window) > 分析 (Analysis) > 性能分析器 (Profiler))。
- 选择窗口左上角的性能分析器模块 (Profiler Module) 下拉选单。选择齿轮图标,性能分析器模块编辑器 (Profiler Module Editor) 将在新窗口中打开。
- 选择添加 (Add),然后从窗口右侧的用户 (User) 列表中选择要可视化的计数器。
重要提示:如果性能分析器窗口中没有加载任何数据,那么在加载性能分析器模块编辑器时,您创建的所有计数器都不会出现在可用计数器窗格中。要查看您的自定义计数器,您必须使用性能分析器捕获或加载一些包含您发出的计数器的数据,然后重新打开性能分析器模块编辑器。
之后,您就可以连同其他计数器一起,也能在分析器窗口中查看这些数据。有关更多信息,请参阅创建自定义性能分析器模块。
注意:在 C# 代码里,被声明为静态的计数器,会在其所属类型初始化时进行动态初始化。在实际完成初始化并开始使用前,这些计数器暂时无法被调用。这在编辑模式和播放模式下均适用。如果您的计数器未出现在性能分析器模块编辑器中,请先使用性能分析器记录几帧的数据。
在构建的播放器中可视化性能分析器计数器
在构建的播放器中运行项目时,无法访问性能分析器窗口。但是,您可以在构建的播放器中将计数器显示为__ UI__(即用户界面,User Interface)让用户能够与您的应用程序进行交互。Unity 目前支持三种 UI 系统。更多信息
See in Glossary 元素。这意味着您可以在应用程序的构建中加入性能分析工具。
下图展示了在构建的播放器中通过使用自定义 UI 将计数器显示在场景的左上角。

注意:并非所有分析器计数器在发布版播放器(非开发版本构建)中都可用。可使用 ProfilerRecorder.Valid 确定数据是否可用以及性能分析器是否可以对其进行记录。或者,也可以使用 ProfilerRecorderHandle.GetAvailable 来枚举所有可用的性能分析器统计信息。
获取播放器中的计数器值
性能分析器计数器可让您深入了解游戏或引擎系统的关键指标。如果您有持续集成设置,或者希望在测试运行期间在应用程序中可视化关键性能指标,可以使用 ProfilerRecorder API 获取自定义和内置的性能分析器计数器值。
例如,以下脚本关于显示帧时间、Mono/IL2CPP 堆大小以及应用程序使用的总内存。
using System.Collections.Generic;
using System.Text;
using Unity.Profiling;
using UnityEngine;

public class StatsScript : MonoBehaviour
{
    string statsText;
    ProfilerRecorder systemMemoryRecorder;
    ProfilerRecorder gcMemoryRecorder;
    ProfilerRecorder mainThreadTimeRecorder;

    double GetRecorderFrameAverage(ProfilerRecorder recorder)
    {
        var samplesCount = recorder.Capacity;
        if (samplesCount == 0)
            return 0;

        double r = 0;
        unsafe
        {
            var samples = stackalloc ProfilerRecorderSample[samplesCount];
            recorder.CopyTo(samples, samplesCount);
            for (var i = 0; i < samplesCount; ++i)
                r += samples[i].Value;
            r /= samplesCount;
        }

        return r;
    }

    void OnEnable()
    {
        systemMemoryRecorder = ProfilerRecorder.StartNew(ProfilerCategory.Memory, "System Used Memory");
        gcMemoryRecorder = ProfilerRecorder.StartNew(ProfilerCategory.Memory, "GC Reserved Memory");
        mainThreadTimeRecorder = ProfilerRecorder.StartNew(ProfilerCategory.Internal, "Main Thread", 15);
    }

    void OnDisable()
    {
        systemMemoryRecorder.Dispose();
        gcMemoryRecorder.Dispose();
        mainThreadTimeRecorder.Dispose();
    }

    void Update()
    {
        var sb = new StringBuilder(500);
        sb.AppendLine($"Frame Time: {GetRecorderFrameAverage(mainThreadTimeRecorder) * (1e-6f):F1} ms");
        sb.AppendLine($"GC Memory: {gcMemoryRecorder.LastValue / (1024 * 1024)} MB");
        sb.AppendLine($"System Memory: {systemMemoryRecorder.LastValue / (1024 * 1024)} MB");
        statsText = sb.ToString();
    }

    void OnGUI()
    {
        GUI.TextArea(new Rect(10, 30, 250, 50), statsText);
    }
}
重要提示:使用 ProfilerRecorder.Dispose 可释放与 ProfilerRecorder 关联的非托管资源。
从编辑器中的性能分析器帧数据获取计数器值
在编辑器中处理性能分析器帧数据时,如要获取性能分析器计数器值,请使用 FrameDataView API。
您可以使用 FrameDataView.GetCounterValueAsInt、FrameDataView.GetCounterValueAsLong、FrameDataView.GetCounterValueAsFloat 和 FrameDataView.GetCounterValueAsDouble 来获取特定计数器的帧值,如下所示:
using UnityEditor.Profiling;

class Example
{
    static int ExtractMyCounterValue(FrameDataView frameData, string counterName)
    {
        var counterMarkerId = frameData.GetMarkerId(counterName);
        return frameData.GetCounterValueAsInt(counterMarkerId);
    }
}