Profiler Module Editor reference
The Profiler Module Editor is a tool you can use to add your own custom modules to the Unity Profiler window. You can also add built-in counters to modules, or use the runtime API to add your own custom counters to modules. For information on how to implement your own counters, refer to Adding profiler counters to your code.

To use the Profiler Module Editor, open the Profiler Window (Window > Analysis > Profiler) and then select the Profiler Modules dropdown.
Select the gear icon, and the Profiler Module Editor window opens.
Profiler Module Editor panels
| Property | Description |
|---|---|
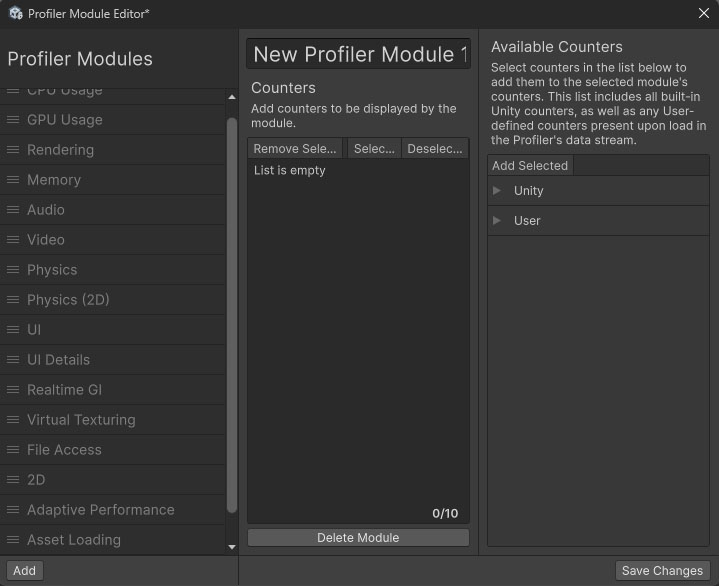
| Profiler Modules | Contains all the available modules you can add to the Profiler Window. Built-in modules are greyed-out in the list, indicating that you can’t edit their contents. You can drag and drop the modules to reorder their appearance in the Profiler window. When you create your own custom Profiler Module, it also appears in this list. |
| Add | Select Add to add a custom Profiler module to the list. The following panels appear: |
| Profiler Module information pane | Set a name for the Profiler module. Also lists the counters added to the custom module. |
| Available Counters | Lists all available counters that you can add to a custom module. This list includes in-built Unity counters, and any custom counters you’ve added to your code. |