Build Profiles Profiler settings
Configure the way the Profiler collects data when you build your application.
The Build Profiles window has settings which you can enable to change how the Profiler measures data.
Prerequisites
To enable the Profiler specific settings, you must enable the Development BuildA development build includes debug symbols and enables the Profiler. More info
See in Glossary setting:
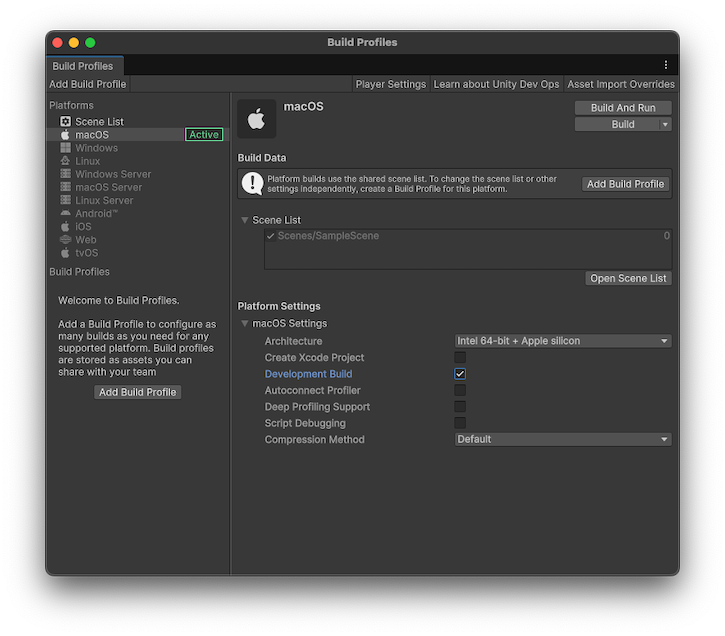
- Open the Build Profiles window (menu: File > Build Profiles)
- Select your application’s target platform
- Enable the Development Build setting
Profiler Build Profiles settings
There are two settings related to how the Profiler collects data.
| Setting | Description |
|---|---|
| Autoconnect Profiler | Enable this setting to automatically connect to the Profiler when your application starts. The Unity Editor bakes its IP address into the built player during the build process. When you start the player, it attempts to connect to the Profiler in the Editor located at the baked IP address. |
| Deep Profiling Support | Unity performs Deep Profiling when the built Player starts, which means that the Profiler profiles every part of your code, and not just code timings explicitly wrapped in Profiler markersPlaced in code to describe a CPU or GPU event that is then displayed in the Unity Profiler window. Added to Unity code by default, or you can use ProfilerMarker API to add your own custom markers. More info See in Glossary. This is useful to get profiling information on your application’s start up times, however, this adds a small amount of overhead to your build. |
Additional resources
- Connecting the Profiler to a data source
- Build ProfilesA set of customizable configuration settings to use when creating a build for your target platform. More info
See in Glossary - Instrument all function calls
- Profiler markers introduction