Adaptive Performance Profiler integration
Visualize Adaptive Performance metrics in the Unity Profiler.
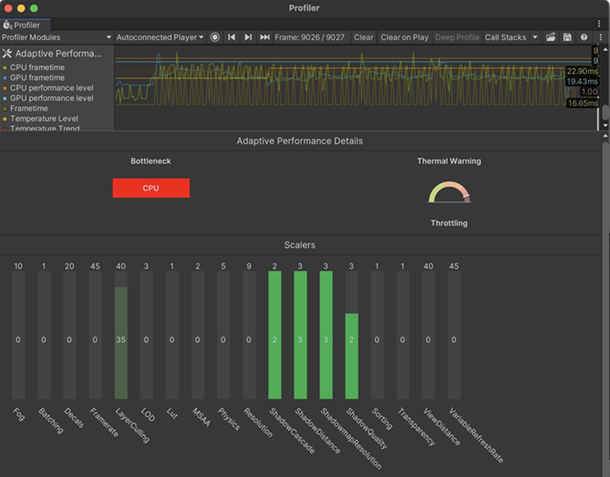
In the Unity Profiler, you can use the Adaptive Performance Profiler module to display status information about scalers, bottlenecks, and thermal warning throttling.
This feature is available in the Unity Editor and for development builds on devices.
Scaler status in the Profiler
The scalers section displays all available scalers. Each bar represents a scaler and displays its current quality level and the maximum level that it can reach.
Scaler status colors
The color of the scaler bar indicates its current state:
| Color | State |
|---|---|
| Gray | Scaler is disabled. |
| Bright green | Scaler is enabled and applied. The Adaptive Performance system is actively adjusting the scaler at this specific frame. |
| Faded green | Scaler is disabled and applied. The Adaptive Performance system is not actively adjusting the scaler at this specific frame, but it has been adjusted in the past and is currently at a non-default level. |
| Blue | Scaler is enabled but not applied. |