Memory Profiler module
There are two ways of analyzing memory usage in your application in Unity:
-
Memory ProfilerA window that helps you to optimize your game. It shows how much time is spent in the various areas of your game. For example, it can report the percentage of time spent rendering, animating, or in your game logic. More info
See in Glossary module: This is a built-in module in the Profiler window, which gives you basic information on where your application uses memory. - Memory Profiler package: This is a separate package that you can add to your Project. It adds an additional Memory Profiler window to the Unity Editor, which you can then use to analyze memory usage in your application in even more detail. You can store and compare snapshots to find memory leaks more easily, or see the memory layout to find memory fragmentation issues.
This page covers information on the built-in Memory Profiler module. For more information on the Memory profiler package, see the Memory Profiler documentation.
The Memory Profiler module visualizes counters that represent the total allocated memory in your application. You can use the memory module to see information like the number of loaded objects, and the memory that they take in total per category. You can also see the number of GC allocations per Profiler frame.
When you profile your application in the Editor, the information in the Memory module indicates the memory usage in the Editor. These numbers are generally larger than when running on the release platform, because running the Unity Editor uses specific objects that take up memory, and the Editor window itself uses extra memory. Additionally, the Profiler displays memory that it uses, because Unity cannot cleanly separate it from the memory that the Play mode Player uses.
For more precise numbers and memory usage for your application, connect the Profiler to the running player via the Attach to Player menu. This allows you to see the actual usage on the target device.
Chart categories
The Memory module is divided into six charts that display detailed information on where your application spends memory. You can change the order of the categories in the chart; to do this, drag and drop them in the chart’s legend. You can also click a category’s colored legend to toggle its display.
| Category | Description |
|---|---|
| Total Allocated | The total memory your application has used |
| Texture Memory | How much memory the TexturesAn image used when rendering a GameObject, Sprite, or UI element. Textures are often applied to the surface of a mesh to give it visual detail. More info See in Glossary in your application have used |
| MeshThe main graphics primitive of Unity. Meshes make up a large part of your 3D worlds. Unity supports triangulated or Quadrangulated polygon meshes. Nurbs, Nurms, Subdiv surfaces must be converted to polygons. More info See in Glossary Memory |
How much memory the Meshes in your application have used |
| Material Count | The number of MaterialAn asset that defines how a surface should be rendered. More info See in Glossary instances in your application |
| Object Count | The number of native object instances in your application |
| Total GC Allocated | The amount of memory used by the GC heap |
| GC Allocated | The amount of memory allocated per frame on the GC heap |
Module details pane
There are two views available in the module details pane, located at the bottom of the Profiler window: Simple and Detailed. To change the view, select it from the dropdown in the top left of the module details pane.
Simple view
The Simple view displays an overview of how memory is used throughout Unity in real-time on a per-frame basis.
Unity reserves memory pools for allocations to avoid asking the operating system for memory too often. This is displayed as a reserved amount, and how much it uses.
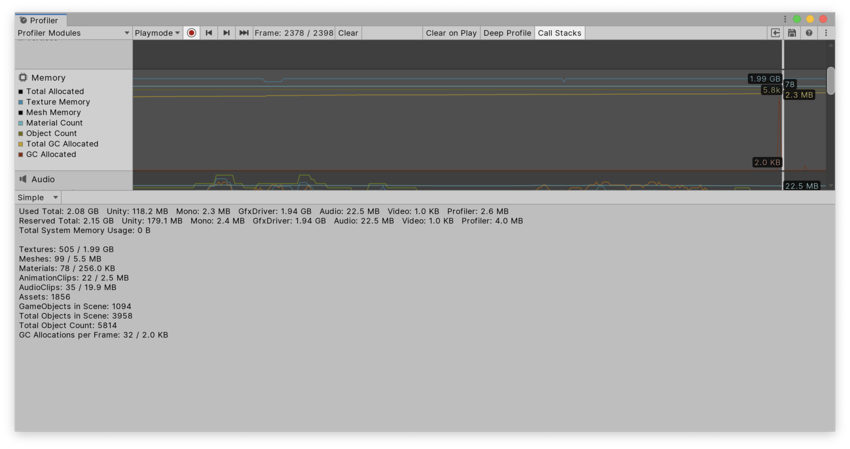
The areas covered by this are:
- Total: Accumulated value from all areas below
- Unity: The amount of memory allocations in native Unity code, tracked by the native memory manager system and allocated in memory pools according to their type, source and platform specific allocation patterns.
- Mono: The total heap size and used heap size managed code uses. This memory is garbage collected.
-
GfxDriver: The estimated amount of memory the driver uses on Textures, render targets, ShadersA program that runs on the GPU. More info
See in Glossary, and Mesh data. - Audio: The Audio system’s estimated memory usage
- Video: The Video system’s estimated memory usage
- Profiler: Total memory the Profiler uses
The values in the Profiler are different to those displayed in your operating system’s task manager, because the Memory Profiler does not track all memory usage in your system. This includes memory some drivers and plug-insA set of code created outside of Unity that creates functionality in Unity. There are two kinds of plug-ins you can use in Unity: Managed plug-ins (managed .NET assemblies created with tools like Visual Studio) and Native plug-ins (platform-specific native code libraries). More info
See in Glossary use, and memory used for executable code. On platforms that support getting the total memory size of the application from the operating system, the Total System Memory Usage is over 0 and is the same size in a task manager.
The Profiler also lists memory statistics for some of the most common Asset and GameObjectThe fundamental object in Unity scenes, which can represent characters, props, scenery, cameras, waypoints, and more. A GameObject’s functionality is defined by the Components attached to it. More info
See in Glossary types. These statistics include the count (before the forward slash) and the used memory. In this list, the Total Object Count displays the total number of native GameObjects that your application creates. If this number rises over time, your application is creating GameObjects and never destroying them.
Detailed view
You can use the Detailed view to take a snapshot of your application’s current state. Click the Take Sample button to capture detailed memory usage for the current target. It takes the Profiler a lot of time to get this data, so the Detailed view does not give you real-time details. After the Profiler takes a sample, the Profiler window displays a tree view where you can explore your application’s memory usage in more detail.
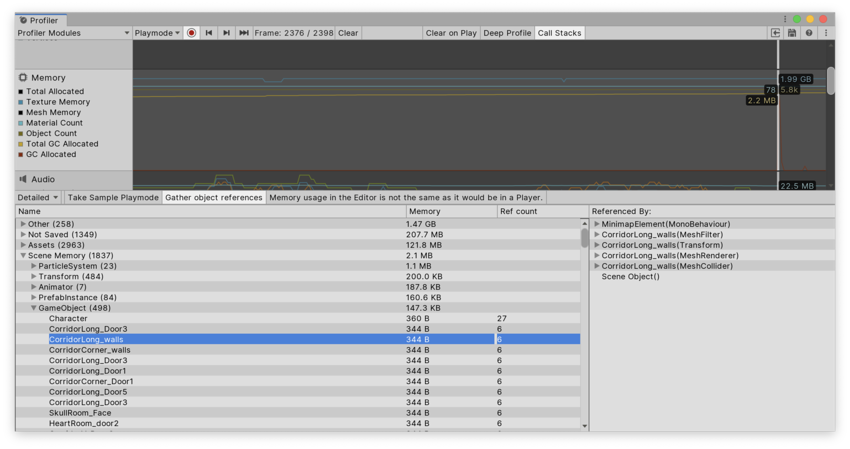
Enable the Gather object references setting at the top of the module details pane to collect information about what might be referencing an object at the time of the snapshot. This information is displayed in the right-hand pane of the window.
The objects that use memory are divided into the following categories in the tree view:
- Other: Objects that are neither assets, GameObjects, or components. Information such as used memory Unity uses for different systems can be found here.
- Not Saved: Objects marked as DontSave
- Builtin Resources: Unity Editor resources or Unity default resources, such as Shaders you have added to the Always Included Shaders list of the Graphics settings.
- Assets: Assets referenced from user or native code
-
SceneA Scene contains the environments and menus of your game. Think of each unique Scene file as a unique level. In each Scene, you place your environments, obstacles, and decorations, essentially designing and building your game in pieces. More info
See in Glossary Memory: Objects and attached components
When you click on an object in the Assets or Scene Memory list, it’s highlighted in the Project or Scene viewAn interactive view into the world you are creating. You use the Scene View to select and position scenery, characters, cameras, lights, and all other types of Game Object. More info
See in Glossary.
Note: In the Other category, memory reported under System.ExecutableAndDlls is read-only memory. The operating system might discard these pages as needed and later reload them from the file system. This generates lower memory usage, and usually does not directly contribute to the operating system’s decision to close your application if it uses too much memory. Some of these pages might also be shared with other applications that are using the same frameworks.