CPU 사용 프로파일러
CPU 사용 프로파일러는 게임의 어느 부분에 시간이 소요되었는지 표시합니다. 프로파일러를 선택하면 선택된 프레임의 계층적 시간 데이터가 하단 창에 표시됩니다. 프로파일러 타임라인에 대한 자세한 내용은 프로파일러 창 문서를 참조하십시오.
- Hierarchy 모드: 계층적 시간 데이터를 표시합니다.
- Group Hierarchy mode: Groups time data into logical groups (Such as Rendering, Physics, Scripts). Because children of any group can also be in different groups (for example, some scripts might also call rendering functions), the percentages of group times often add up to more than 100%.
차트 레이블을 위 아래로 드래그하여 CPU 차트 스택 순서를 변경할 수 있습니다.
개별 항목 선택
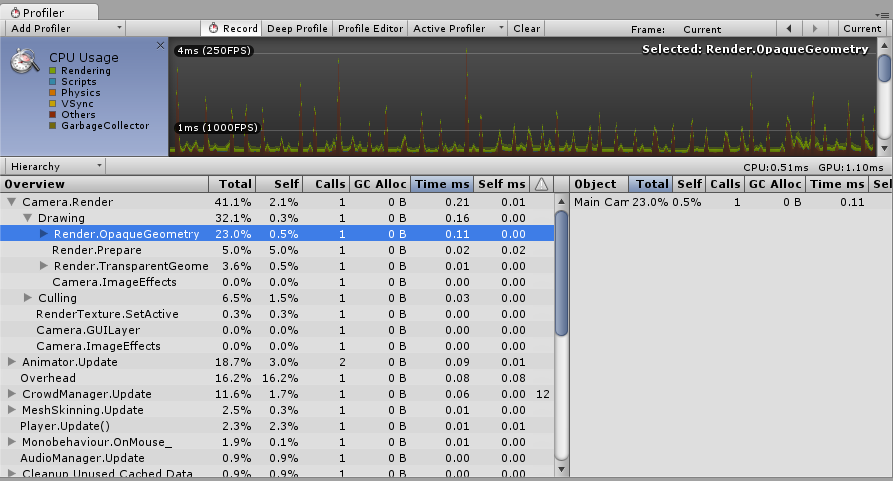
하단 창에서 항목을 선택하면 CPU 차트에 항목의 기여도가 강조 표시되고 나머지 항목이 어둡게 표시됩니다. 항목을 다시 클릭하면 선택 해제됩니다.
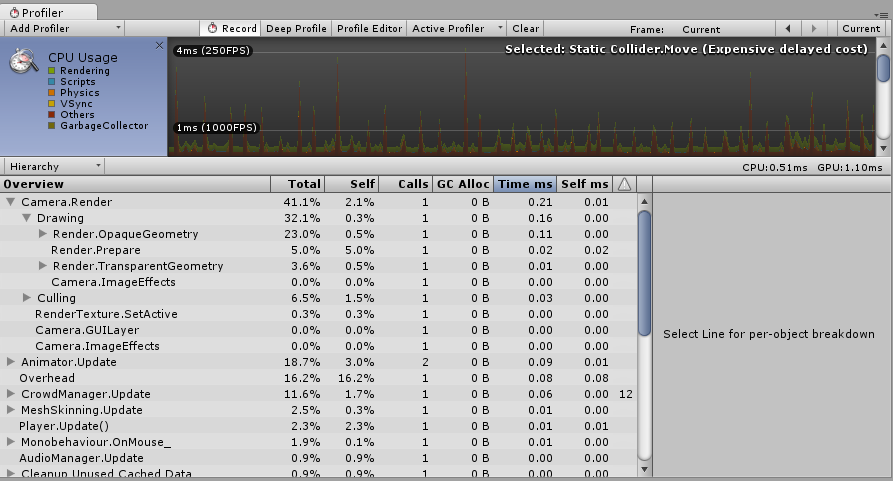
계층적 시간 데이터에서 Self 열에는 특정 함수에 소요된 시간이 표시되고 하위 함수 호출에 소요된 시간은 포함되지 않습니다. 위 스크린샷에서 Camera.Render 함수에 소요된 시간은 41.1%입니다. 이 함수는 많은 작업을 수행하지 않고 다양한 드로우 및 컬링 함수를 호출합니다. 이런 함수를 모두 제외하면 Camera.Render 함수 자체에 소요된 시간은 2.1%에 불과합니다.
The Time ms and Self ms columns show the same information, but presented in milliseconds. Camera.Render takes 0.01ms, but including all the functions it calls, 0.21ms are consumed. The GC Alloc column shows how much memory has been allocated in the current frame, which is later collected by the garbage collector. Keep this value at zero to prevent the garbage collector from causing hiccups in your framerate.
The Others section of the CPU profiler records the total of all areas that do not fall into Renderer, Scripts, Physics, Garbage Collection or VSync. This includes Animation, AI, Audio, Particles, Networking, Loading, and PlayerLoop.
물리 마커
The descriptions below provide a brief account of what each of the various high-level Physics Profiler markers mean:
-
Physics.Simulate:
FixedUpdate에서 호출됩니다. 물리 엔진(PhysX)에 시뮬레이션 실행을 지시하여 현재 물리 상태를 업데이트합니다. -
Physics.Processing:
FixedUpdate에서 호출됩니다. 여기서 천이 아닌 물리 작업이 모두 처리됩니다. 이 마커를 확장하면 물리 엔진 내부에서 수행 중인 작업의 로우 레벨 세부 정보가 표시됩니다. -
Physics.ProcessingCloth:
FixedUpdate에서 호출됩니다. 여기서 천 물리 작업이 모두 처리됩니다. 이 마커를 확장하면 물리 엔진 내부에서 수행 중인 작업의 로우 레벨 세부 정보가 표시됩니다. -
Physics.FetchResults:
FixedUpdate에서 호출됩니다. 여기서 물리 시뮬레이션 결과가 물리 엔진으로부터 수집됩니다. -
Physics.UpdateBodies:
FixedUpdate에서 호출됩니다. 여기서 모든 물리 바디의 포지션 및 회전이 업데이트되고 해당 업데이트를 알리는 메시지가 전송됩니다. -
Physics.ProcessReports:
FixedUpdate에서 호출됩니다. 이 스테이지는FixedUpdate업데이트가 완료된 후에 실행되고, 시뮬레이션 결과에 대응하는 다양한 스테이지가 모두 처리되는 위치입니다. 여기서 접점, 조인트 브레이크 및 트리거가 업데이트되고 관련 메시지가 전송됩니다. 다음과 같은 개별 하위 스테이지가 4개 있습니다.-
Physics.TriggerEnterExits:
FixedUpdate에서 호출됩니다. 여기서OnTriggerEnter및OnTriggerExit이벤트가 처리됩니다. -
Physics.TriggerStays:
FixedUpdate에서 호출됩니다. 여기서OnTriggerStay이벤트가 처리됩니다. -
Physics.Contacts:
FixedUpdate에서 호출됩니다. 여기서OnCollisionEnter,OnCollisionExit및OnCollisionStay이벤트가 처리됩니다. -
Physics.JointBreaks:
FixedUpdate에서 호출됩니다. 여기서 조인트 브레이크와 관련된 업데이트 및 메시지가 처리됩니다.
-
Physics.TriggerEnterExits:
-
Physics.UpdateCloth:
Update에서 호출됩니다. 여기서 천과 천의 스킨드 메시와 관련된 업데이트가 수행됩니다. -
Physics.Interpolation:
Update에서 호출됩니다. 이 스테이지에서 모든 물리 오브젝트 포지션 및 회전 보간을 처리합니다.
성능 경고
There are some common performance issues the CPU Profiler is able to detect and warn you about. These appear in the Warning column of the lower pane, when viewing the CPU Usage.
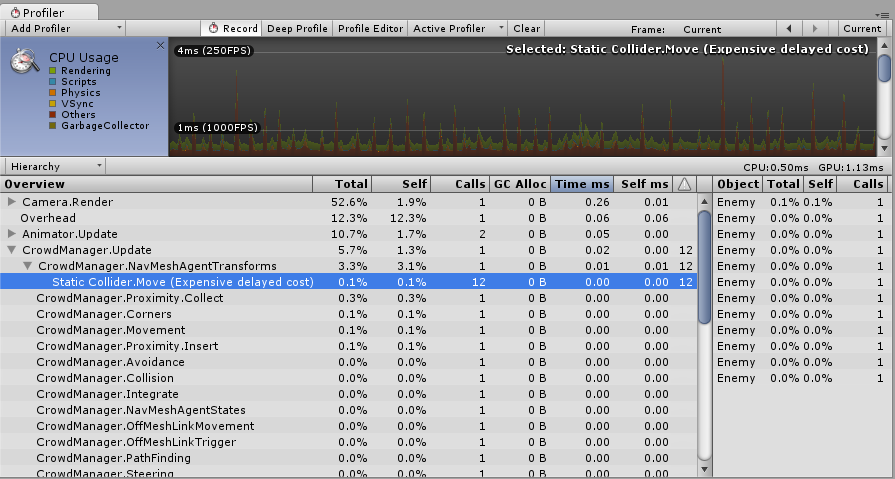
프로파일러에서 감지할 수 있는 구체적인 문제는 다음과 같습니다.
- Static Collider.Modify (Expensive delayed cost)
- Static Collider.Move (Expensive delayed cost)
- Static Collider.Create (Expensive delayed cost)
- Animation.DestroyAnimationClip [Triggers RebuildInternalState]
- Animation.AddClip [Triggers RebuildInternalState]
- Animation.RemoveClip [Triggers RebuildInternalState]
- Animation.Clone [Triggers RebuildInternalState]
- Animation.Deactivate [Triggers RebuildInternalState]
In the screenshot above, the Profiler is showing the Static Collider.Move warning. The Warning column shows that this warning has been triggered 12 times in the current frame. The term “Delayed Cost” means that although the entry in the Profiler may show a low cost (in this case 0.00ms), the action may trigger more system-demanding operations later on.