Profiler window
Attaching to Unity players
To profile your game running on an other device or a player running on another computer, it is possible to connect the editor to that other player. The dropdown Active Profiler will show all players running on the local network. These players are identified by player type and the host name running the player “iPhonePlayer (Toms iPhone)”. To be able to connect to a player, the player must be launched with the Development Build checkbox found in the Build Settings dialog. From here it is also possible to tick a checkbox to make the Editor and Player Autoconnect at startup.
Profiler Controls

Profiler controls are in the toolbar at the top of the window. Use these to turn profiling on and off, navigate through profiled frames and so on. The transport controls are at the far right end of the toolbar. Note that when the game is running and the profiler is collecting data clicking on any of these transport controls will pause the game. The controls go to the first recorded frame, step one frame back, step one frame forward and go to the last frame respectively. The profiler does not keep all recorded frames, so the notion of the first frame should really be though of as the oldest frame that is still kept in memory. The “current” transport button causes the profile statistics window to display data collected in real-time. The Active Profiler popup menu allows you to select whether profiling should be done in the editor or a separate player (for example, a game running on an attached iOS device).
세부 프로파일링
Deep Profile 을 켜면 모든 스크립트 코드가 프로파일링됩니다. 즉, 모든 함수 호출이 기록됩니다. 게임 코드에서 시간이 정확히 어디에 소요되었는지 알고 싶을 때 유용합니다.
세부 프로파일링(Deep Profiling)은 오버헤드가 매우 크고 메모리를 많이 사용하므로, 프로파일링 중에는 게임이 훨씬 더 느리게 실행됩니다. 복잡한 스크립트 코드를 사용하는 경우 세부 프로파일링이 전혀 불가능할 수도 있습니다. 스크립트가 간단한 작은 게임에서는 세부 프로파일링이 충분히 빠르게 작동합니다. 전체 게임에 세부 프로파일링을 사용함으로 인해 게임이 겨우 실행될 정도로 프레임 속도가 많이 떨어지는 경우 이 방법을 사용하지 않고 아래에 설명된 방법을 사용할 수 있습니다. 세부 프로파일링은 게임을 디자인하고 주요 기능을 구현하는 가장 좋은 방법을 결정할 때 더 유용할 수있습니다. 대형 게임에 세부 프로파일링을 사용할 경우 Unity에서 메모리가 부족해질 수 있기 때문에 세부 프로파일링이 불가능할 수 있습니다.
Manually profiling blocks of your script code will have a smaller overhead than using Deep Profiling. Use Profiler.BeginSample and Profiler.EndSample scripting functions to enable and disable profiling around sections of code.
SyncTime 보기
고정 프레임 속도로 실행하거나 수직 공백과 동기화하여 실행하는 경우 대기 시간이 “타겟 FPS 대기(Wait For Target FPS)”에 기록됩니다. 이 시간은 기본적으로 프로파일러에 표시되지 않습니다. “싱크타임 보기(View SyncTime)”를 토글하여 대기하는 데 시간을 얼마나 보냈는지 확인할 수 있습니다. 이 시간은 프레임을 잃기 전에 얼마나 여유가 있는지 나타내는 척도이기도 합니다.
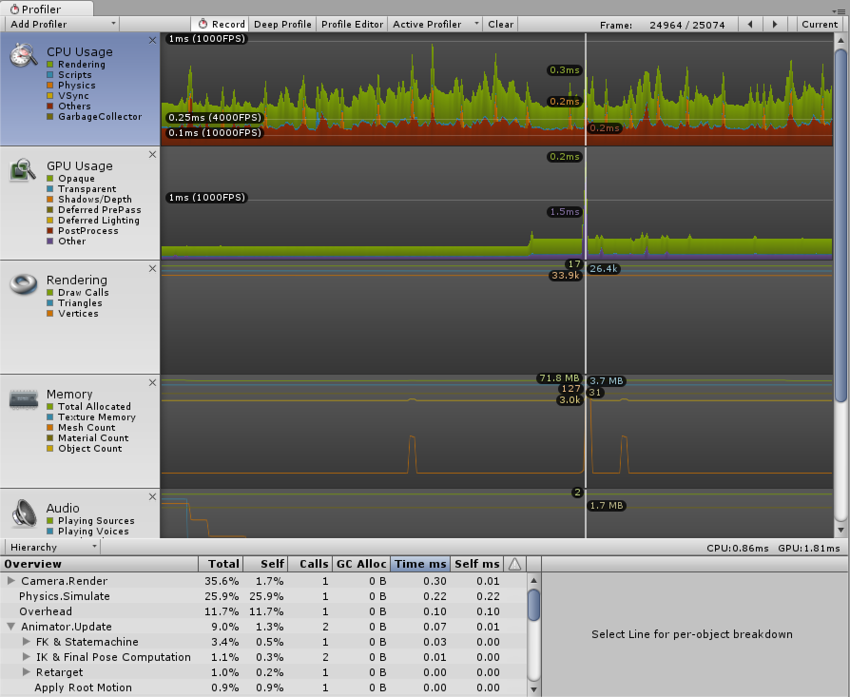
Profiler Timeline
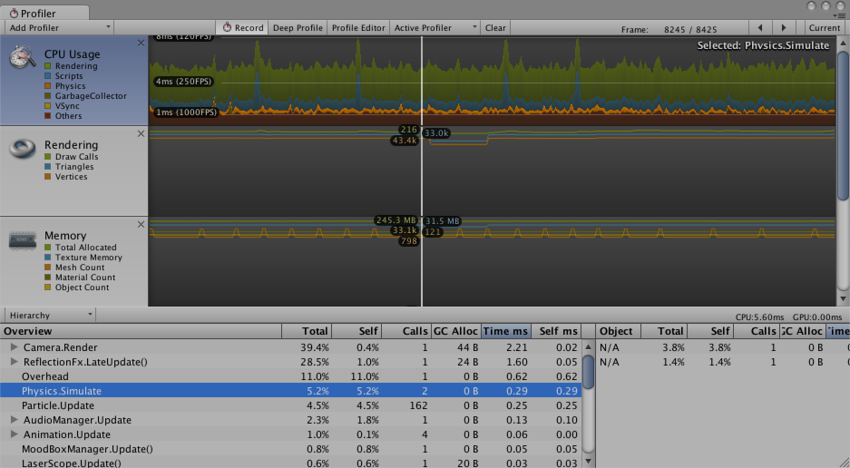
프로파일러 창의 상단에는 시간에 따른 성능 데이터가 표시됩니다. 게임을 실행하면 데이터가 각 프레임에 기록되고 최근에 일어난 수백 프레임의 이력이 표시됩니다. 특정 프레임을 클릭하면 세부 정보가 창 하단에 표시됩니다. 현재 선택된 타임라인 영역에 따라 표시되는 세부 정보가 다릅니다.
타임라인의 수직 스케일은 자동으로 관리되고 창의 수직 공간을 채우려고 합니다. 예를 들어 CPU 사용 영역 등에 대한 더 많은 세부 정보를 확인하려면 메모리 및 렌더링 영역을 제거할 수 있습니다. 타임라인과 통계 영역 사이에 있는 스플리터를 선택하고 아래로 드래그하여 타임라인 차트에 사용되는 화면 영역을 확대할 수도 있습니다.
타임라인은 CPU 사용, 렌더링 및 메모리 영역으로 구성됩니다. 패널의 닫기 버튼을 클릭해 각 영역을 제거하고 프로파일 컨트롤 바의 Add Area 드롭다운을 사용해 다시 추가할 수 있습니다.
레이블 영역에 있는 유색 사각형으로 관련 타임라인 표시 여부를 제어할 수 있습니다. 디스플레이에서 샘플을 제거하려면 컬러 키를 클릭합니다. 키가 흐리게 표시되고 데이터가 그래프에서 제거됩니다. 이렇게 하면 예를 들어 CPU 그래프에 스파이크가 표시된 원인을 확인하는 데 유용할 수 있습니다.