Profiler modules introduction
Collect specific performance data about your application with Profiler modules.
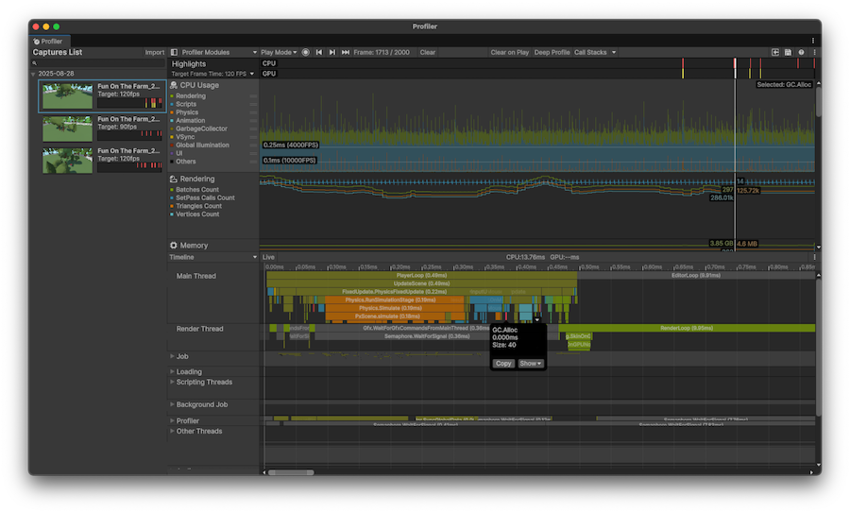
The top area of the Profiler window contains Profiler modules that profile specific areas of your application. When you profile your application, Unity displays the data related to each module in corresponding charts.
The Profiler includes default Profiler modules. When you install a package, it might include its own module, for example, the Entities Profiler modules or the Adressables profiler module. You can also create a custom Profiler module.
Module types
The CPU Usage module provides an overview of how much time your application spends on each frame. The other modules collect data which you can use to inspect specific areas or to monitor the vitals of your application, such as memory consumption, rendering, or audio statistics.
Each module has its own chart. When you select a module, the details panel in the bottom section of the Profiler window displays detailed data that the module collects. You can then use this data to identify areas of improvement in your application.
Default Profiler modules
The Profiler window includes the following Profiler modules by default. To learn about other Profiler properties and settings, refer to Profiler window reference.
| Module | Description |
|---|---|
| Highlights | Displays information on whether your application is meeting its target frame rate and if its performance is bound by the CPU or the GPU. For more information, refer to the Highlights Profiler module. |
| CPU Usage | Displays an overview of where your application spends the most time, in areas such as physics, scriptsA piece of code that allows you to create your own Components, trigger game events, modify Component properties over time and respond to user input in any way you like. More info See in Glossary, animation, and garbage collection. This module contains broad profiling information about your application, and you can use it to decide which further modules to use to investigate more specific issues in your application. This module is always active, even if you close it. For more information, refer to CPU Usage Profiler module. |
| GPU Usage | Displays information related to graphics processing. By default this module isn’t active, because it has a high overhead. For more information, refer to GPU Usage Profiler module. |
| Rendering | Displays information on how Unity renders graphics in your application. For more information, refer to Rendering Profiler module. |
| Memory | Displays information on how Unity allocates memory in your application. This module is useful to investigate how scripting allocations lead to garbage collection, or how your application’s asset memory usage trends over time. For more information, refer to Memory Profiler module. |
| Audio | Displays information related to the audio in your application, such as how much CPU usage the audio system requires, and how much memory Unity allocates to it. For more information, refer to Audio Profiler module. |
| Video | Displays information related to video in your application. For more information, refer to Video Profiler module. |
| Physics | Displays information about the physics in your application that the physics system has processed. For more information, refer to Physics Profiler module. |
| Physics (2D) | Displays information about where the physics system has processed 2D physics in your application. For more information, refer to 2D Physics Profiler module. |
| UI (Canvas) | Displays information about how uGUI handles UI batching for your application, including why and how uGUI batches items. For more information, refer to UI (Canvas) and UI Details (Canvas) Profiler module. |
| UI Details (Canvas) | This module’s chart adds data about batch and vertices count, and markers which include information about user input events that trigger uGUI’s UI changes. For more information, refer to UI (Canvas) and UI Details (Canvas) Profiler module. |
| Realtime GI | Displays information on how much CPU resource Unity spends on the Global IlluminationA group of techniques that model both direct and indirect lighting to provide realistic lighting results. See in Glossary lighting subsystem in your application. For more information, refer to Global Illumination Profiler window. |
| Virtual Texturing | Displays statistics about Streaming Virtual Texturing in your application. For more information, refer to Virtual Texturing Profiler module. |
| File Access | Displays information about file accesses in your application. For more information, refer to File Access Profiler module. |
| 2D | Displays information about how many spritesA 2D graphic objects. If you are used to working in 3D, Sprites are essentially just standard textures but there are special techniques for combining and managing sprite textures for efficiency and convenience during development. More info See in Glossary Unity renders and which sprite atlases it uses. For more information, refer to 2D Profiler module. |
| Asset Loading | Displays information about how your application loads assets. For more information, refer to Asset Loading Profiler module. |
| Profiler module editor (⚙) | Open the Profiler module editor to customize the Profiler modules in the list. |
| Restore defaults | Select Restore Defaults to remove any custom Profiler modules and reorder the module list to its default ordering. |
Custom Profiler modules
You can add your own Profiler modules to the Profiler window to capture and visualize specific performance data in your application. You can either use the Profiler Module Editor or use scripts to automatically create and populate modules.
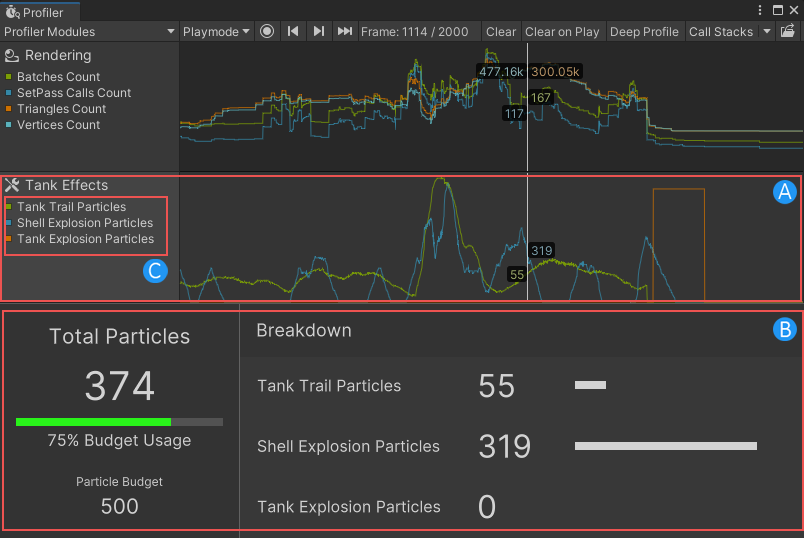
The following image of a customized Profiler window contains:
- A: A custom Profiler module named Tank Effects.
- B: A custom module details panel that visualizes the data in the Tank Effects profiler module.
-
C: Custom Profiler counters which track particleA small, simple image or mesh that is emitted by a particle system. A particle system can display and move particles in great numbers to represent a fluid or amorphous entity. The effect of all the particles together creates the impression of the complete entity, such as smoke. More info
See in Glossary data.
For more information, refer to Customizing Profiler modules.