Highlights Profiler module reference
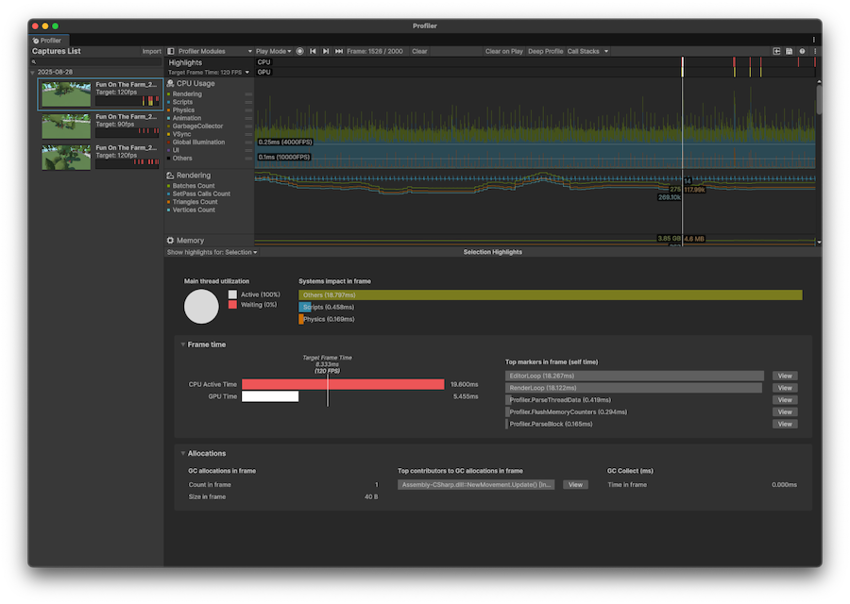
The Highlights Profiler module displays information on whether your application meets its target frame rate and if its performance is bound by the CPU or the GPU. It can help you to determine where to begin investigating potential performance problems.
This module isn’t enabled by default. To enable the Highlights Profiler module, refer to Activating Profiler modules
Target Frame Time
Use the dropdown to set a target frames per second (FPS) for your application. Select from a preset value, or select Custom to set your own. When you select Custom, the Profiler Preferences window opens.
Chart
The Highlights chart flags any frames that have exceeded the application’s target frame rate. It displays this information in two lanes of markers:
| Value | Description |
|---|---|
| CPU | Displays red markers in any frames where the CPU has exceeded the target frame time |
| GPU | Displays yellow markers in any frames where the GPU has exceeded the target frame time |
Hover over any frame in the chart to view a short summary of the frame, including the times of the CPU and the GPU.
Details pane
When you select a frame in the Highlights chart, the module’s Details view displays more detailed information about the frame. You can optionally select multiple frames to analyze. To select multiple frames click and drag the desired selection on the Highlights chart. The details pane then displays information about the selection of frames.
You can use the dropdown in the top left of the panel to either display information about the selection, or the entire data capture.
Main thread utilization
If you select a single frame, this displays the amount of active time on the main thread, versus the amount of time spent waiting during the frame.
Bottlenecks
If you select a range of frames, or the entire capture, then the Bottlenecks section displays the total number of frames that went over the target frame time, divided by CPU and GPU resource.
Systems impact
Displays the categories which contributed to the most amount of time during the capture.
Frame time
Displays information about where the most time was spent in this capture.
The CPU Active Time and GPU Time are displayed as bar charts relative to the target frame time. To achieve your target frame rate, you must keep the CPU Active Time and the GPU Time below the target frame time. The reason that both the CPU and the GPU each individually have the full frame time to complete their work is because the Unity engine does CPU and GPU work in parallel to achieve optimal performance.
Select a chart to open the CPU timeline or Frame Debugger respectively to begin your performance investigation.
CPU Active Time
The CPU Active Time is the duration within the frame that the CPU was doing work for. Unity computes this value by taking the longest thread duration between the main thread and the render thread after subtracting the time that thread spent waiting.
On the main thread, this means that Unity subtracts any VSync related markers which don’t represent actual work on the thread, such as WaitForTargetFPS or Gfx.WaitForPresentOnGfxThread to calculate the thread’s active time. On the render thread, Unity subtracts the time spent waiting for commands as indicated by the marker Gfx.WaitForGfxCommandsFromMainThread, to calculate the thread’s active time.
It’s possible for the CPU Active Time to be longer than the CPU Time value displayed in the CPU Usage module’s Timeline view when the render thread took longer than the main thread. This is because the Timeline view displays the beginning and end of the frame on the main thread.
GPU Time
GPU Time is the duration between when the GPU was sent its first command for the frame and when the GPU completed its work for that frame.
You can find guidance on the next steps to take and where to begin your performance investigation in the panel on the right.
Top markers
Displays information about the markers that took up the most time in the capture. The information displayed differs depending on whether you select a single frame, or a selection:
| Metric | Description |
|---|---|
| Top markers in frame | Displayed only if you select a single frame. Displays the markers that took the most time during the frame. Select View to view the marker in the CPU Hierarchy view. |
| Top markers on longest frame | Displayed only on selections of multiple frames. Displays information about the markers in the frame that took the longest amount of time, along with the frame number. Select the frame number to view the single frame in the Highlights module. |
| Top markers across capture | Displayed only on selections of multiple frames. Displays the markers that took the most amount of time across the entire selection, along with the frame number. Select the frame number to view the single frame in the Highlights module. |
Allocations
Displays information about the garbage collection performed.
GC allocations
Displays the count, and size of allocations in the capture, or across the selected frames..
Top contributors to GC allocations
Displays the markers of the items which contributed to the most garbage collection in the capture, or across the selected frames.
GC Collect
Displays the time in ms that the garbage collection took.