CPU Usage Profiler module
The CPU Usage ProfilerA window that helps you to optimize your game. It shows how much time is spent in the various areas of your game. For example, it can report the percentage of time spent rendering, animating or in your game logic. More info
See in Glossary module contains a chart that displays where time is spent in your application. It provides an overview of all the significant areas where your application spends time, such as on renderingThe process of drawing graphics to the screen (or to a render texture). By default, the main camera in Unity renders its view to the screen. More info
See in Glossary, its scriptsA piece of code that allows you to create your own Components, trigger game events, modify Component properties over time and respond to user input in any way you like. More info
See in Glossary, and animation. This section of the documentation covers:
- Chart categories
- Module details pane
- Timeline view
- Hierarchy and Raw Hierarchy view
- Allocation call stacks
- Common markers
Chart categories
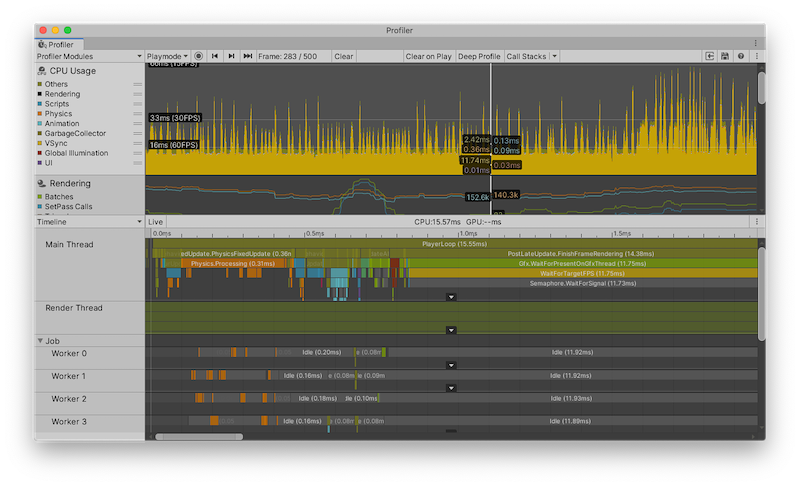
The CPU Usage Profiler module’s chart tracks the time spent on the application’s main thread. The timings are divided into nine categories. To change the order of the categories in the chart, you can drag and drop them in the chart’s legend. You can also click a category’s colored legend to toggle its display.
| Category | Description |
|---|---|
| Rendering | How much time your application spends on rendering graphics. |
| Scripts | How much time your application spends on running scripts. |
| Physics | How much time your application spends on the physics engineA system that simulates aspects of physical systems so that objects can accelerate correctly and be affected by collisions, gravity and other forces. More info See in Glossary. |
| Animation | How much time your application spends on animating Skinned Mesh RenderersA mesh component that takes the geometry from the Mesh Filter and renders it at the position defined by the object’s Transform component. More info See in Glossary, GameObjectsThe fundamental object in Unity scenes, which can represent characters, props, scenery, cameras, waypoints, and more. A GameObject’s functionality is defined by the Components attached to it. More info See in Glossary and other components in your application. This also includes the time spent on calculations for systems the Animation and Animator componentsA component on a model that animates that model using the Animation system. The component has a reference to an Animator Controller asset that controls the animation. More info See in Glossary use. |
| GarbageCollector | How much time your application spends on running the Garbage Collector. |
| VSyncVertical synchronization (VSync) is a display setting that caps a game’s frame rate to match the refresh rate of a monitor, to prevent image tearing. More info See in Glossary |
How much time your application spends per frame waiting for the targetFrameRate or the next VBlank to sync with. This is according to the QualitySettings.vSyncCount value, the target framerate, or the VSync setting that is the default or enforced maximum of the platform your application is running on. For more information about VSync, see the section in this documentation on Rendering and VSync samples. |
| Global IlluminationA group of techniques that model both direct and indirect lighting to provide realistic lighting results. Unity has two global illumination systems that combine direct and indirect lighting.: Baked Global Illumination, and Realtime Global Illumination (deprecated). See in Glossary |
How much time your application spends on lighting. |
| UI(User Interface) Allows a user to interact with your application. More info See in Glossary |
How much time your application spends on displaying its UI. |
| Others | How much time your application spends on code that does not fall into any of the other categories. This includes areas like the entire EditorLoop, or the Profiling overhead when you profile Play Mode in the Editor. |
Module details pane
When you select the CPU Usage module, the details pane below it displays a breakdown of where the application spent time in the selected frame. You can display the timing data as either a timeline or a hierarchical table. To change the display, use the top-left dropdown in the details pane (set to Timeline by default). The three views available are:
| View | Function |
|---|---|
| Timeline | Displays a breakdown of the timings for a particular frame, alongside a time axis of the frame’s length. This is the only view mode that you can use to see timings on all threads at once and at the times within the frame at which they happened, so that you can correlate timings across threads (for example, Job System worker threads starting up after a system on the main thread schedules them). |
| Hierarchy | Groups the timing data by its internal hierarchical structure. This option displays the elements that your application called in a descending list format, ordered by the time spent by default. You can also order the information by the amount of scripting memory allocated (GC Alloc), or the number of calls. To change the column that orders the table, click the table column’s header. |
| Raw Hierarchy | Displays the timing data in a hierarchical structure that is similar to the call stacks where the timing occurred. Unity lists each call stack separately in this mode instead of merging them, as it does in Hierarchy view. |
Live setting
The Live setting, which is available in each of the views, displays the information about the current or selected frame in the module details pane when you start recording new data in Playmode or the Editor. To enable this, click the Live button next to the module details dropdown. By default, this setting is disabled, and the module details pane is blank when you record data. Note: This setting increases the overhead of the EditorLoop when the Profiler window is repainted.
Show Full Scripting Method Names setting
Additionally, in each view, you can select the More Items menu (⋮) and enable Show Full Scripting Method Names, which then displays the fully qualified names for all scripting methods (Assembly::Class::MethodName).
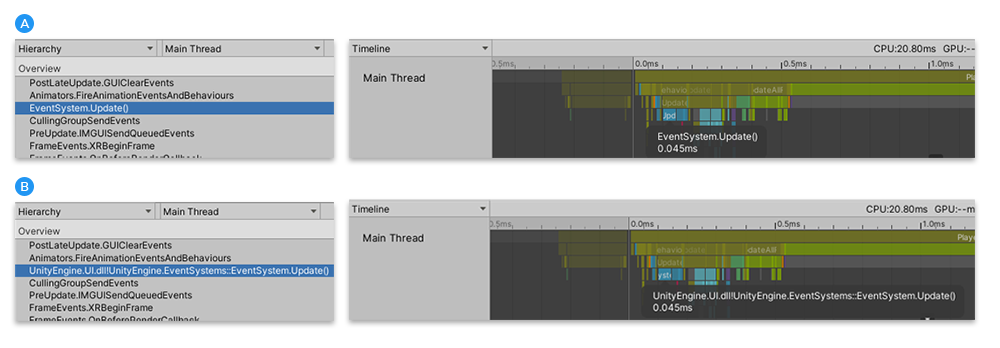
B: Scripting methods in the Hierarchy view and Timeline view with Show Full Scripting Method Names enabled
Timeline view
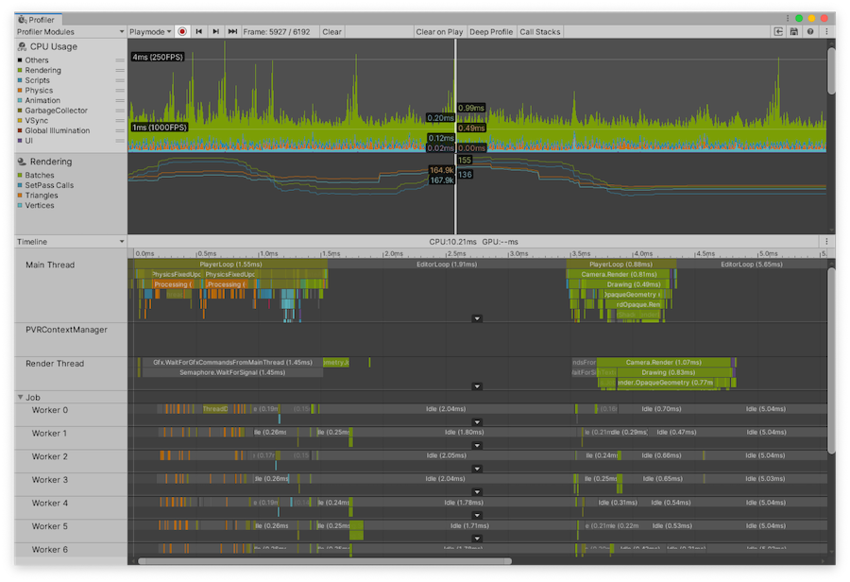
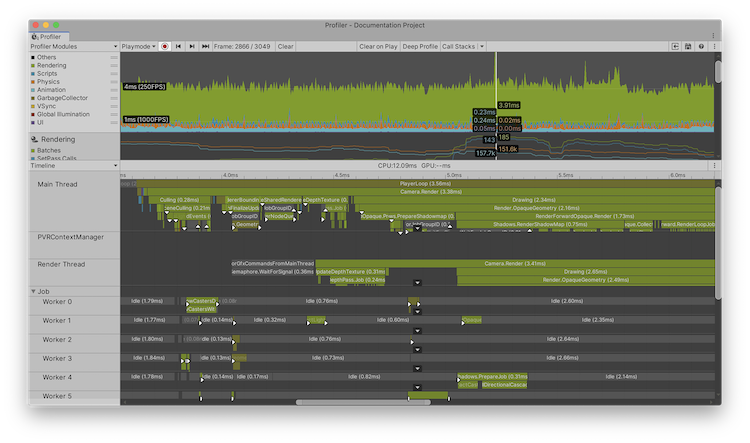
The Timeline view is the default view for the CPU Usage Profiler module. It contains an overview of where time is spent in your application and how the timings relate to each other. The Timeline view displays profiling data from all threads in their own subsections and along the same time axis, unlike the Hierarchy views. The Hierarchy views only display profiling data one thread at a time, defaulting to the main thread. Also, these views only show a sample’s duration, whereas the Timeline view shows at which times each sample occurred.
You can use the Timeline view to see how activities on the different threads correlate to each other in their parallel execution. You can see how much or little you are using the different threads, such as the Job System’s worker threads, how work on the threads are queued up, and if any thread is idling (Idle sample) or waiting for another thread or a Job to finish (Wait for x sample).
Navigating and selecting items
To zoom in on areas of the time axis, use the scroll wheel on your mouse, or press and hold the Alt key while you drag with the right mouse button pressed down. You can also use the ends of the horizontal scrollbar to zoom in. Press the A key on your keyboard to reset the zoom so that the entire frame time is visible.
Whenever you see a white arrow on the bottom of a thread, you can click it to unfold the thread to show all lines, or click again to show only the top ones. You can also drag the line that separates the threads to readjust how many lines you can see. Double-clicking the line sets the height of the thread’s section to the maximum depth of the call stack. To pan the view, press the middle mouse button, or hold the Alt key (Command key on macOS) and press the left mouse button.
To collapse and expand groups of threads, click on the foldout arrows next to the thread names on the far left of the view.
To see an item’s contribution to the CPU chart, select it in the lower pane. The Profiler highlights its contribution, and dims the rest of the chart. To deselect the item, click elsewhere in the view. Press the F key to focus the current sample you selected, or to show the default zoom level if you’ve selected nothing.
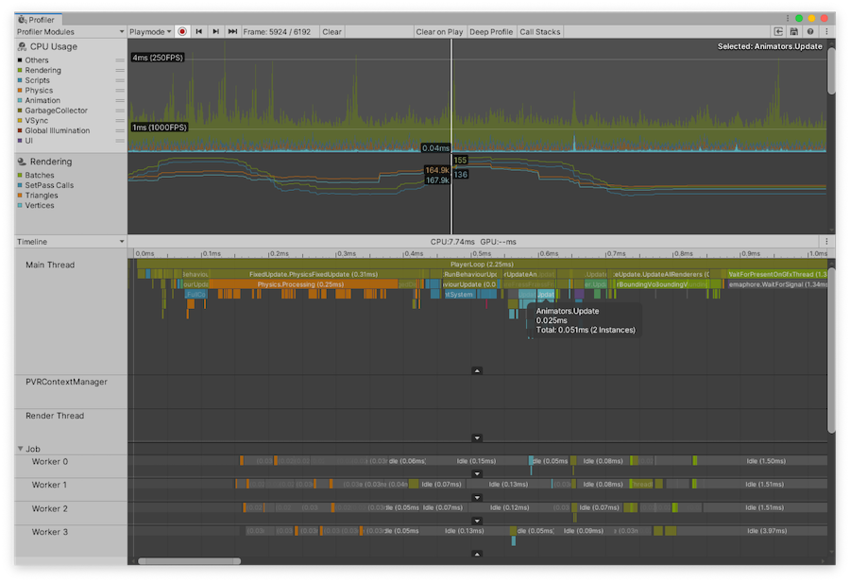
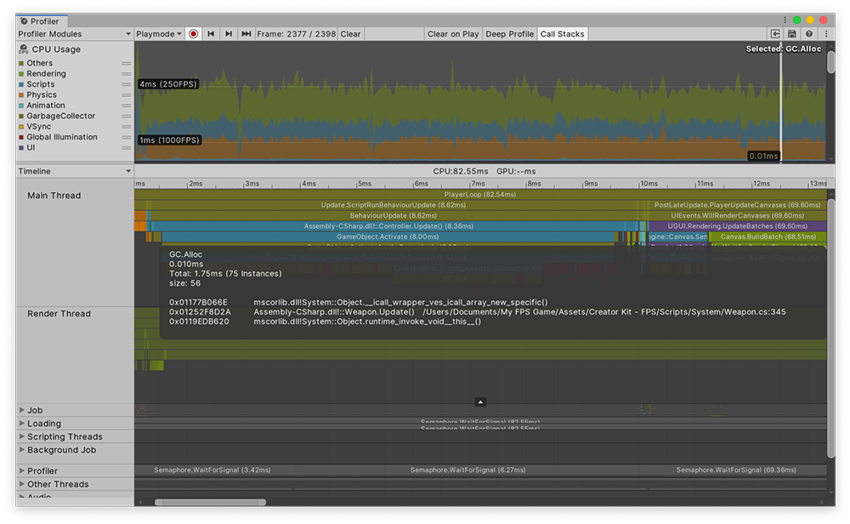
In the image above, the tooltip on the selected item provides further details, such as the number of instances and the total time of this sample across all threads. GC.Alloc samples appear colored in red-magenta, and show you the size of the allocation.
To show managed call stacks in the tooltip, navigate to the Profiler window’s toolbarA row of buttons and basic controls at the top of the Unity Editor that allows you to interact with the Editor in various ways (e.g. scaling, translation). More info
See in Glossary, and select the Call Stacks button. You must enable this property before you profile a frame to display the call stack for a frame. For more information, see the section on Allocation call stacks.
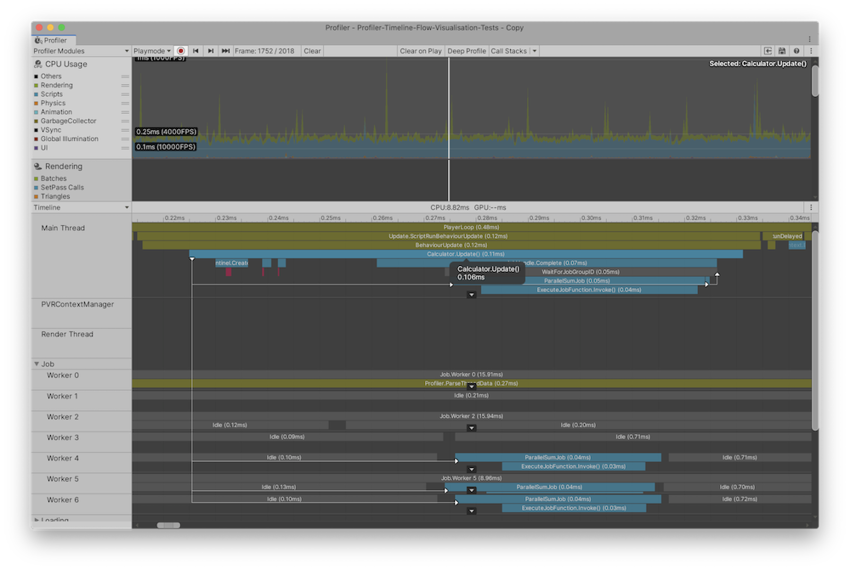
Flow Events
To help you visualize how Unity schedules jobs across threads, you can use the Flow Events setting. This setting displays the relationship between systems, jobs and threads. To enable this setting, select the More menu (⋮) in the top right of the Timeline view pane, and then select Show Flow Events.
When you enable this setting, the Profiler adds white event markers to the Profiler samples that schedule jobs, or wait on scheduled jobs to complete. It also darkens unrelated samples so that you can more easily visualize the sample you select.
There are three types of arrows the Profiler adds to the samples:
- Down arrow: Indicates the beginning of a flow, and that this sample scheduled some work.
- Right arrow: Indicates the next item in a flow, and that a different sample scheduled this.
- Up arrow: Indicates the end of a flow, and that the work ended or synchronized on this sample.
When you select a sample, the Profiler connects the relevant flow event markers together with lines. A thicker line highlights the particular flow line you select. For example, if a begin sample points to two other next samples, when you click one of the next samples, the Profiler draws a thicker line to it.
This view is useful to discover the flow of execution of your code, what work was being waited on to complete, and helps you uncover the dependencies
See in Glossary of your code in a visual way.
Hierarchy and Raw Hierarchy view
When you switch to the Hierarchy or Raw Hierarchy view, your selection carries over, as long as the sample is on the main thread. If you cannot immediately find your selection, press the F key to focus it.
The Hierarchy view lists all samples you have profiled and groups them together by their shared call stack and the hierarchy of ProfilerMarkers. The Raw Hierarchy view does not group samples together, which makes it ideal for looking into samples on a granular level. You can also use the Thread dropdown to select a specific thread, like the Main Thread or Render Thread to inspect in these views.
By default, all EditorOnly samples are collapsed in these views. EditorOnly samples are samples in the Player Loop that only happen because of Editor-only safety checks. When the samples are collapsed, their GC.Alloc value does not contribute to the GC.Alloc value of their enclosing sample. To display these samples, select the More Items menu (⋮) in the top right of the details pane, and then disable the Collapse EditorOnly Samples setting. For more information, see the Editor only samples section of this documentation.
Both views display the following detailed information for each item in the Hierarchy, next to each row:
| Property | Function |
|---|---|
| Total | The total amount of time Unity spent on a particular function, as a percentage. |
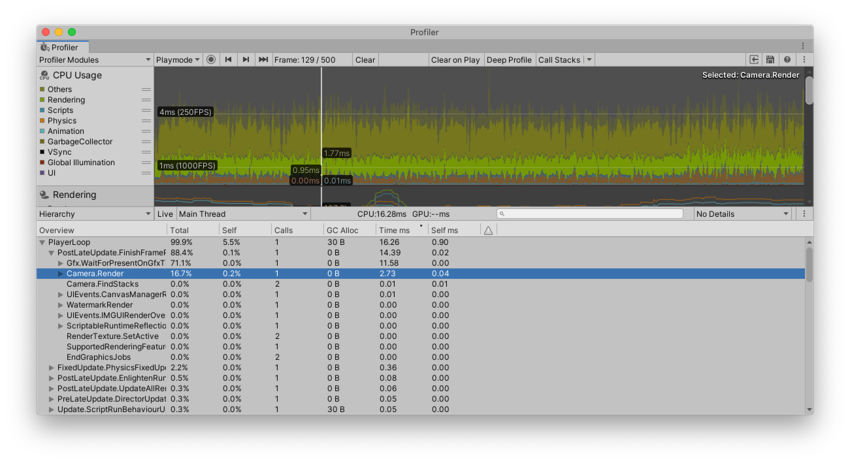
| Self | The total amount of time Unity spent on a particular function as a percentage, excluding the time Unity spends calling sub-functions. For example, in the screenshot, 16.7% of time is spent in the Camera.Render function. This is because it calls a lot of drawing and culling functions. However, when you exclude the functions it calls, only 0.2% of time is spent on the Camera.Render function itself. |
| Calls | The number of calls made to this function in this frame. In the Raw Hierarchy view the values in this column are always 1 because the Profiler does not merge the hierarchy of samples. |
| GC Alloc | How much scripting heap memory Unity has allocated in the current frame. The scripting heap memory is managed by the garbage collector. Whenever Unity calls GC.Collect() or there is a scripting heap allocation that does not fit within the heap’s current size, the garbage collector triggers. It marks all allocations that have no more references to them and collects them. This process appears as GC.Collect samples in the Profiler. Unity runs the garbage collector more frequently as you allocate more on the heap. As the managed heap grows, it takes Unity longer to mark and collect the memory. As such, you should keep the GC Alloc value at zero while your application runs, to prevent the garbage collector from affecting your framerate, and keep the overall heap size small. For more details about the managed heap see the documentation on Understanding Automatic Memory Management. |
| Time ms | The total amount of time Unity spent on a particular function, in milliseconds. If your application uses the Job System or multithreaded rendering, this information might be misleading, because it only contains the time Unity spent on the currently selected thread. To change the thread, select the Thread dropdown at the top of the Hierarchy pane. |
| Self ms | The total amount of time Unity spent on a particular function, in milliseconds, excluding the time Unity spends calling sub-functions. |
| Warning | Indicated by a warning icon, this displays how many times the application has triggered a warning during the current frame. For more information, see the Performance warnings section of this documentation. |
To get more information about where your application calls and uses the profiled functions, select the Details dropdown at the top right hand corner of the module details pane and choose either Show Related Objects or Show Calls view.
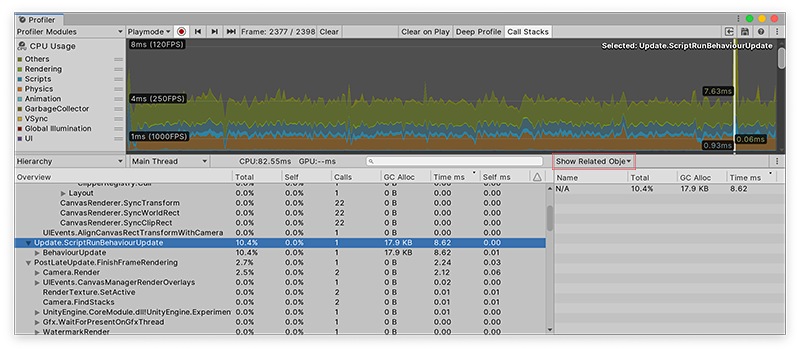
The Show Related Objects view displays a list of UnityEngine.Objects that use a Begin() overload and are associated with the Profiler sample. Some samples that Unity reports have these associations built in, such as CameraA component which creates an image of a particular viewpoint in your scene. The output is either drawn to the screen or captured as a texture. More info
See in Glossary.Render samples that are linked to the Camera GameObject that does the rendering. Unity reports these objects via their instance ID and resolves them to a name in the Profiler window, if you profile in the Editor. When you profile a built player, or load a capture from disk, these names do not appear and the Profiler displays them as N/A.
When you click on one of these objects, Unity tries to find the object via the SceneA Scene contains the environments and menus of your game. Think of each unique Scene file as a unique level. In each Scene, you place your environments, obstacles, and decorations, essentially designing and building your game in pieces. More info
See in Glossary hierarchy and ping it. Because the association uses the instance ID, pinging only works when you profile your application in the Editor, and for as long as the object still exists.
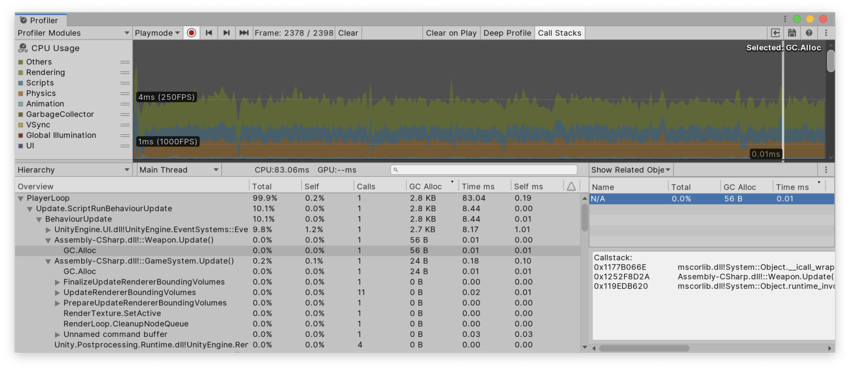
For GC.Alloc samples, this view displays a list of N/A items, one for each allocation that happened at this hierarchy level, with the size of the allocation listed in the GC.Alloc column. If you profile your application with the Call Stacks setting enabled, when you select a GC.Alloc sample in this view, the Profiler window displays the call stack for the allocated scripting object you select, even if you did not enable the Deep Profiling setting. For more information, see the Allocation call stacks section of this documentation.
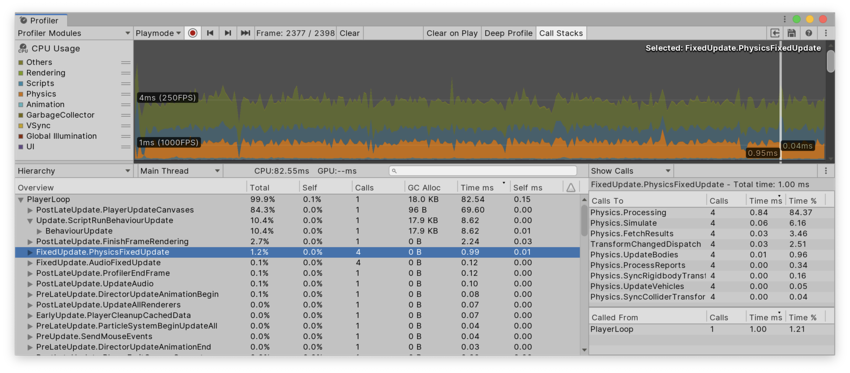
The Show Calls view displays where the selected sample is being called from as well as what other functions it calls to.
Allocation call stacks
By default, allocated call stacks on GC.Alloc samples are disabled, because they can disrupt your application with multi frame delay. However, you sometimes might want to see the full call stack to see how Unity executes your code.
To do this, navigate to the toolbar of the Profiler window, and select the Call Stacks button. You can use this functionality whether you profile in the Editor or on a running Player. In the frames you profile after you turn this option on, the GC.Alloc samples contain their callstacks.
Every scripting heap allocation shows up as a GC.Alloc sample in both the Hierarchy view and Timeline view. In Timeline view, it is colored bright magenta. To see a call stack, select the CPU Profiler Module and select a GC.Alloc sample in Timeline view. The call stack appears in the selection highlight.
Alternatively you can see the call stack in Hierarchy or Raw Hierarchy view. Set the Details view to Show Related Objects. Because GC.Alloc samples have no name, they show up as N/A in this panel. When you select an N/A object, the Profiler displays the call stack in the bottom half of the details view.
For more information about managed allocations, see documentation on Understanding Automatic Memory Management.
Common markers
Unity’s code is instrumented with a large number of Profiler markers that give you insight into what is taking up time in your application. For a full list of the most common markers you might see in your profiling data, see the documentation on Common Profiler markers.