UI and UI Details Profiler
The UI(User Interface) Allows a user to interact with your application. More info
See in Glossary and UI Details ProfilerA window that helps you to optimize your game. It shows how much time is spent in the various areas of your game. For example, it can report the percentage of time spent rendering, animating, or in your game logic. More info
See in Glossary modules provide information on how much time and resources Unity spends laying out and renderingThe process of drawing graphics to the screen (or to a render texture). By default, the main camera in Unity renders its view to the screen. More info
See in Glossary the user interface within your application. You can use this module to understand how Unity handles UI batching for your application, including why and how it batches objects. You can also use this module to find out which part of the UI is responsible for slow performance, or to preview the UI while you scrub the timeline.
For more information on how to use the Profiler window, see the documentation on Getting started with the Profiler window.
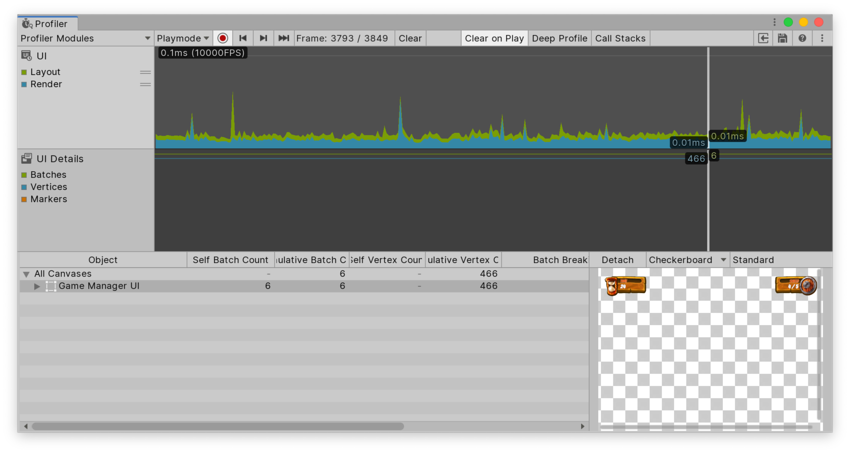
Chart categories
The UI and UI Details Profiler modules’ charts are divided into five categories. To change the order of the categories in the chart, you can drag and drop them in the chart’s legend. You can also click a category’s colored legend to toggle its display.
| Chart | Description | |
|---|---|---|
| UI Profiler module | ||
| Layout | How much time Unity has spent performing the layout pass for the UI. This includes calculations done by HorizontalLayoutGroup, VerticalLayoutGroup, and GridLayoutGroup. | |
| Render | How much time the UI has spent doing its portion of rendering. This is either the cost of rendering directly to the graphics device or rendering to the main render queue. | |
| UI Details Profile module | ||
| Batches | Displays the total number of draw calls that are batched together. | |
| Vertices | The total number of vertices that are used to render a section of UI. | |
| Markers | Displays event markers. Unity records markers when the user interacts with the UI (for example, a button click, or a slider value change) and then draws them as vertical lines and labels on the chart. | |
Module details pane
When you select the UI or the UI Details Profiler module, the module details pane at the bottom of the Profiler window displays more details on the UI in your application. You can use it to inspect the profiling information about the UI objects in your application. The pane is divided into the following columns:
| Column | Description |
|---|---|
| Object | A list of UI canvases your application used during the period profiled. Double click on a row to highlight the matching object in the SceneA Scene contains the environments and menus of your game. Think of each unique Scene file as a unique level. In each Scene, you place your environments, obstacles, and decorations, essentially designing and building your game in pieces. More info See in Glossary. |
| Self Batch Count | How many batches Unity generated for the canvas. |
| Cumulative Batch Count | How many batches Unity generated for the canvas and all of its nested canvases |
| Self Vertex Count | How many vertices this canvas is rendering. |
| Cumulative Vertex Count | How many vertices this canvas and nested canvases are rendering |
| Batch Breaking Reason | Why Unity split the batch. Sometimes Unity might not be able to batch objects together. Common reasons include: Not Coplanar With Canvas, where the batching needs the object’s rect transform to be coplanar (unrotated) with the canvas. CanvasInjectionIndex, where a CanvasGroup component is present and forces a new batch, such as when it displays the drop down list of a combo box on top of the rest. Different Material Instance, Rect clipping, Texture, or A8TextureUsage, where Unity can only batch together objects with identical materials, masking, textures, and texture alpha channel usage. |
| GameObjectThe fundamental object in Unity scenes, which can represent characters, props, scenery, cameras, waypoints, and more. A GameObject’s functionality is defined by the Components attached to it. More info See in Glossary Count |
How many GameObjects are part of this batch |
| GameObjects | The list of GameObjects in the batch. |
When you select a UI object from the list, a preview of it appears on the right hand side of the pane. Above the preview there are the following options in the toolbarA row of buttons and basic controls at the top of the Unity Editor that allows you to interact with the Editor in various ways (e.g. scaling, translation). More info
See in Glossary:
- Detach: Select this button to open the UI canvas in a separate window. To reattach the window, close it.
- Preview background: Use the dropdown to change the color of the preview background. You can choose from Checkerboard, Black, or White. This is useful if your UI has a particularly light or dark color scheme.
- Preview type: Use the dropdown to select from Standard, Overdraw, or Composite Overdraw.