Область CPU Usage
В этой области можно увидеть что и сколько времени занимает в вашей игре. При выборе кадра в нижней части окна отображаются иерархически выстроенные данные о времени.
- Режим Hierarchy: Отображает иерархически выстроенные данные о времени.
- Режим Group Hierarchy: Объединяет данные о времени в логические группы (Рендеринг, Физика, Скрипты и т.д.). Так как элемент в одной группе может при этом находиться и в другой группе (например, скрипт может вызывать функции рендеринга), то общие проценты группы могут быть более 100% (это не ошибка).
Drag chart labels up and down to reorder the way the CPU chart is stacked.
Selecting individual items
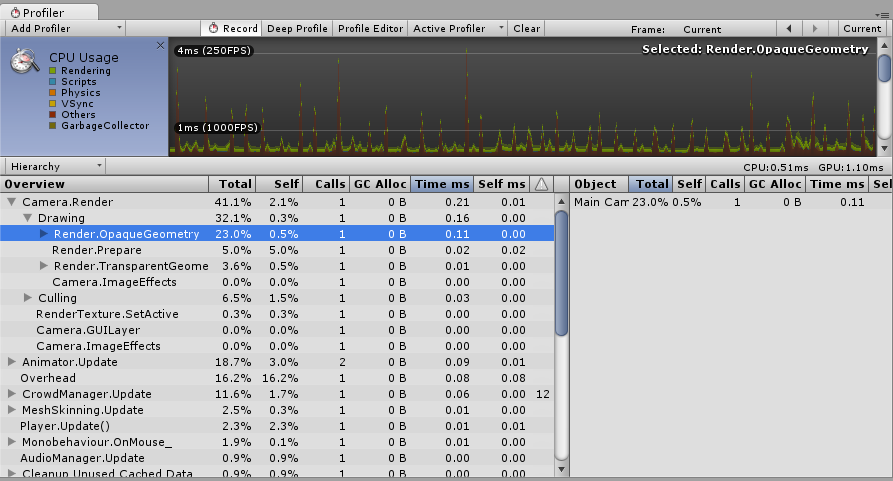
Выбранный в нижней панели элемент подсвечивается в диаграмме в соответствии с его значением относительно других элементов (остальная часть диаграммы затемняется). Повторный клик по элементу снимает выделение.
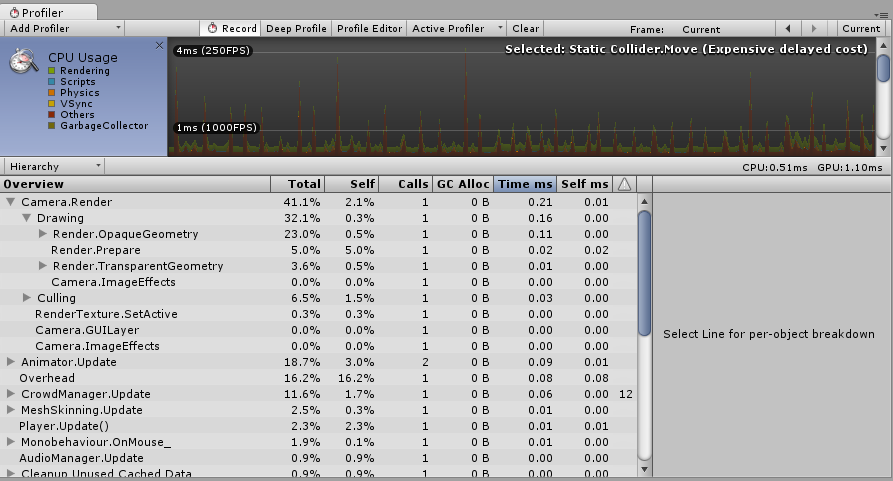
In the hierarchical time data, the Self column refers to the amount of time spent in a particular function, not including the time spent calling sub-functions. In the screenshot above, 41.1% of time is spent in the Camera.Render function. This function does a lot of work, and calls the various drawing and culling functions. Excluding all of these functions, only 2.1% of time is spent in the Camera.Render function itself.
В иерархических данных о времени, колонка self отвечает за количество времени, потраченное в определённой функции без учёта времени исполнения подфункций. Например, на скриншоте, представленном выше, 51.2% времени потрачено в функции Camera.Render. Эта функция совершает много работы и вызывает различные отрисовывающие и culling функции. Не считая все эти функции, в самой функции Camera.Render тратится только 0.8% времени.
Секция Others CPU профайлера показывает общее потребление всеми областями, не вошедшими в Rendering, Scripts, Physics, Garbage Collection или VSync. Такие области включают в себя анимацию, AI, аудио, частицы, сеть, загрузку и цикл проигрывателя.
Physics markers
The descriptions below provide a brief account of what each of the various high-level Physics Profiler markers mean:
-
Physics.Simulate: Called from
FixedUpdate. This updates the present state of the physics by instructing the physics engine (PhysX) to run its simulation. -
Physics.Processing: Called from
FixedUpdate. This is where all the non-cloth physics jobs are processed. Expanding this marker shows low-level detail of the work being done internally in the physics engine. -
Physics.ProcessingCloth: Called from
FixedUpdate. This is where all the cloth physics jobs are processed. Expanding this marker will show low level detail of the work being done internally in the physics engine. -
Physics.FetchResults: Called from
FixedUpdate. This is where the results of the physics simulation are collected from the physics engine. -
Physics.UpdateBodies: Called from
FixedUpdate. This is where all the physics bodies have their positions and rotations updated as well as where messages that communicate these updates are sent. -
Physics.ProcessReports: Called from
FixedUpdate. This stage is run once the physicsFixedUpdatehas concluded, and is where all the various stages of responding to the results of the simulation are processed. Contacts, joint breaks and triggers are updated and messaged here. There are four distinct sub stages:-
Physics.TriggerEnterExits: Called from
FixedUpdate. This is whereOnTriggerEnterandOnTriggerExitevents are processed. -
Physics.TriggerStays: Called from
FixedUpdate. This is whereOnTriggerStayevents are processed. -
Physics.Contacts: Called from
FixedUpdate. This is whereOnCollisionEnter,OnCollisionExitandOnCollisionStayevents are processed. -
Physics.JointBreaks: Called from
FixedUpdate. This is where updates and messages relating to joints being broken is processed.
-
Physics.TriggerEnterExits: Called from
-
Physics.UpdateCloth: Called from
Update. This is where updates relating to cloth and their skinned meshes are made. -
Physics.Interpolation: Called from
Update. This stage deals with the interpolation of positions and rotations for all the physics objects.
Performance warnings
There are some common performance issues the CPU Profiler is able to detect and warn you about. These appear in the Warning column of the lower pane, when viewing the CPU Usage.
The specific issues the Profiler can detect are:
- Static Collider.Modify (Expensive delayed cost)
- Static Collider.Move (Expensive delayed cost)
- Static Collider.Create (Expensive delayed cost)
- Animation.DestroyAnimationClip [Triggers RebuildInternalState]
- Animation.AddClip [Triggers RebuildInternalState]
- Animation.RemoveClip [Triggers RebuildInternalState]
- Animation.Clone [Triggers RebuildInternalState]
- Animation.Deactivate [Triggers RebuildInternalState]
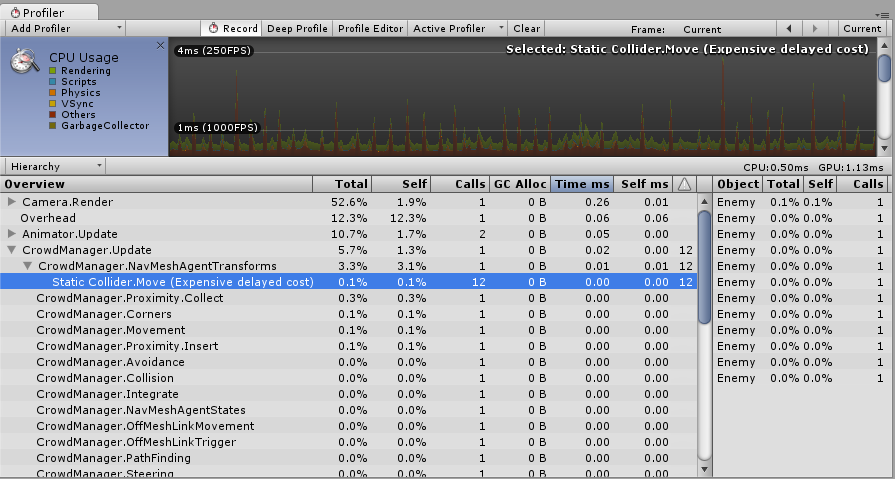
In the screenshot above, the Profiler is showing the Static Collider.Move warning. The Warning column shows that this warning has been triggered 12 times in the current frame. The term “Delayed Cost” means that although the entry in the Profiler may show a low cost (in this case 0.00ms), the action may trigger more system-demanding operations later on.