Monitor Unity Accelerator
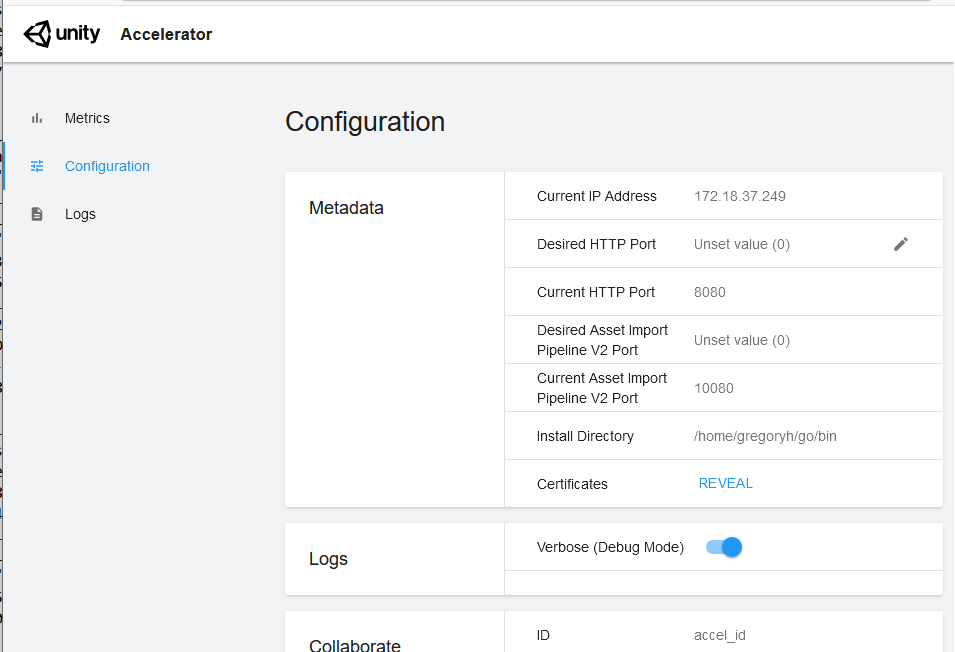
Unity Accelerator has a built-in dashboard to monitor and configure changes.
The URL to access your dashboard is http://ip:port/dashboard where ip:port is the IP and port number of the Unity Accelerator you have installed. Note that the default http port is 80 but you can change this during installation. If left as default 80, then it doesn’t need to be specified here.
Each Unity Accelerator hosts Prometheus metric reports as http://ip:port/metrics, which you can query from the local network. For a full list of metrics monitoring, refer to Unity Accelerator Prometheus metrics reference. The full configuration of Unity Accelerator is available through its unity-accelerator.cfg file.