エディターとランタイム UI での円グラフの作成
バージョン: 2023.2 以降
この例では、Vector API を使用して、エディターとランタイム UI でグラフを作成する方法を示しています。
例の概要
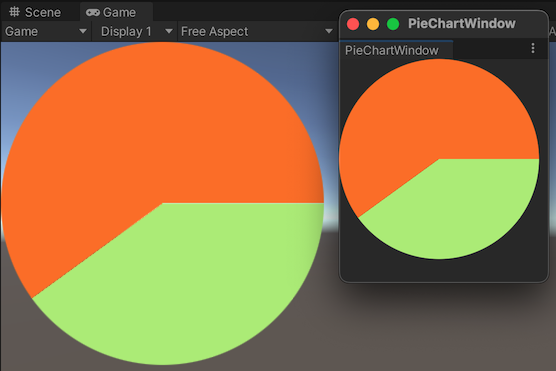
この例では、円グラフを VisualElement に生成しエディターとランタイム UI に表示しています。
この例で作成する完成したファイルは、こちらの GitHub リポジトリにあります。
必要な要件
このガイドは、Unity エディター、UI Toolkit、および C# スクリプトに精通している開発者を対象としています。始める前に、以下の点を理解しておいてください。
円グラフの作成
Vector API の Arc メソッドと Fill メソッドを使用して、ビジュアル要素に円グラフを描画する C# スクリプトを作成します。
- 任意のテンプレートで Unity プロジェクトを作成します。
- ファイルを保存するための
pie-chartという名前のフォルダーを作成します。 -
pie-chartフォルダーに、以下の内容の C# スクリプトを作成しPieChart.csという名前を付けます。
using System.Collections;
using System.Collections.Generic;
using UnityEngine;
using UnityEngine.UIElements;

[UxmlElement]
public partial class PieChart : VisualElement
{
    float m_Radius = 100.0f;
    float m_Value = 40.0f;

    public float radius
    {
        get => m_Radius;
        set
        {
            m_Radius = value;
        }
    }

    public float diameter => m_Radius * 2.0f;

    public float value {
        get { return m_Value; }
        set { m_Value = value; MarkDirtyRepaint(); }
    }

    public PieChart()
    {
        generateVisualContent += DrawCanvas;
    }

    void DrawCanvas(MeshGenerationContext ctx)
    {
        var painter = ctx.painter2D;
        painter.strokeColor = Color.white;
        painter.fillColor = Color.white;

        var percentage = m_Value;

        var percentages = new float[] {
            percentage, 100 - percentage
        };
        var colors = new Color32[] {
            new Color32(182,235,122,255),
            new Color32(251,120,19,255)
        };
        float angle = 0.0f;
        float anglePct = 0.0f;
        int k = 0;
        foreach (var pct in percentages)
        {
            anglePct += 360.0f * (pct / 100);

            painter.fillColor = colors[k++];
            painter.BeginPath();
            painter.MoveTo(new Vector2(m_Radius, m_Radius));
            painter.Arc(new Vector2(m_Radius, m_Radius), m_Radius, angle, anglePct);
            painter.Fill();

            angle = anglePct;
        }
    }
}
エディター UI で円グラフを追加する
- ファイルを保存するための
Editorという名前のフォルダーを作成します。 -
Editorフォルダーに、以下の内容の C# スクリプトを作成しPieChartWindow.csという名前を付けます。
using UnityEditor;
using UnityEngine;
using UnityEngine.UIElements;

public class PieChartWindow : EditorWindow
{
    [MenuItem("Tools/PieChart Window")]
    public static void ShowExample()
    {
        PieChartWindow wnd = GetWindow<PieChartWindow>();
        wnd.titleContent = new GUIContent("PieChartWindow");
    }

    public void CreateGUI()
    {
        VisualElement root = rootVisualElement;

        root.Add(new PieChart());
    }
}
Editor ウィンドウで円グラフを表示するには、メニューから Tools > PieChart Window の順に選択します。
ランタイム UI で円グラフを追加する
SampleScene の UIDocument ゲームオブジェクトに円グラフを追加します。これを行うには、pie-chart フォルダー PieChartComponet.cs に以下の内容の C# スクリプトを作成します。
using System.Collections;
using System.Collections.Generic;
using UnityEngine;
using UnityEngine.UIElements;

[RequireComponent(typeof(UIDocument))]
public class PieChartComponent : MonoBehaviour
{
    PieChart m_PieChart;

    void Start()
    {
        m_PieChart = new PieChart();
        GetComponent<UIDocument>().rootVisualElement.Add(m_PieChart);
    }
}
ランタイムに円グラフを表示するには、次の手順を行います。
- サンプルシーンで GameObject > UI Toolkit > UI Document の順に選択します。
- 階層で UIDocument ゲームオブジェクトを選択します。
- UIDocument ゲームオブジェクトのコンポーネントとして PieChartComponet.cs を追加します。
- 再生モードに切り替えると、シーン内の円グラフが表示されます。