
Analyzing SOLO Datasets with Pysolotools
Pysolotools is a Python package that provides a variety of tools for processing, analyzing, and converting SOLO datasets created with the Perception package. In addition to a Python library, the package comes with an example Jupyter notebook that helps you load datasets and analyze a set of common statistics.
In this guide, we will go through the steps involved in opening SOLO datasets and verifying them using the provided Jupyter notebook. To learn how to generate datasets locally follow Phase 1 of the Perception Tutorial. Although we will use the dataset created in that tutorial in this guide, these same processes can be applied to any SOLO dataset.
Setting Up Your Python Environment
The first thing that we will need to do is to setup our Python environment. This guide assumes that you already have Python 3.8 or higher installed on your machine.
To avoid a Python configuration nightmare, we highly recommend using a virtual Python environment for development. For this tutorial we will use Anaconda, but this is just a recommendation and not mandatory. For more information about Anaconda environments, and why you should use one, please see here.
- 🟢 Action: Download and install Anaconda or Miniconda on your local machine
- 🟢 Action: Create a virtual environment. For this example we are naming our environment
pysolotools_env, but this name is up to you
conda create --name pysolotools_env python=3.8
- 🟢 Action: Activate the new Conda environment
conda activate pysolotools_env
Install Pysolotools
- 🟢 Action: Install pysolotools using pip with the following command
pip install pysolotools
ℹ️ TODO: The above will not work until we go public. Until then you need to install pysolotools with
pip install pysolotools --index-url=https://artifactory.prd.it.unity3d.com/artifactory/api/pypi/pypi/simplethis info should be removed when we go public
Using a Jupyter Notebook to analyze the SOLO Dataset
Pysolotools comes with an example Jupyter notebook that can open and calculate statistics about the dataset.
- 🟢 Action: Install jupyter notebook using pip with the following command
pip install jupyter
The notebook is located on the Pysolotools Git repository.
- 🟢 Action: In your Git capable command line shell, navigate to a folder where you would like to clone the Pysolotools repo.
- 🟢 Action: Clone pysolotools.
git clone https://github.com/Unity-Technologies/pysolotools
cd pysolotools
ℹ️ TODO: The above will need HTTPS authentication to be setup by the user until the repo goes public. this info should be removed when we go public
The notebook has a number of dependencies. Let's install those now.
- 🟢 Action: Install the notebook's dependencies:
pip install matplotlib
pip install pandas
pip install seaborn
- 🟢 Action: Start a Jupyter Server
jupyter notebook
After starting your Jupyter server, you should see results similar to this in your shell:

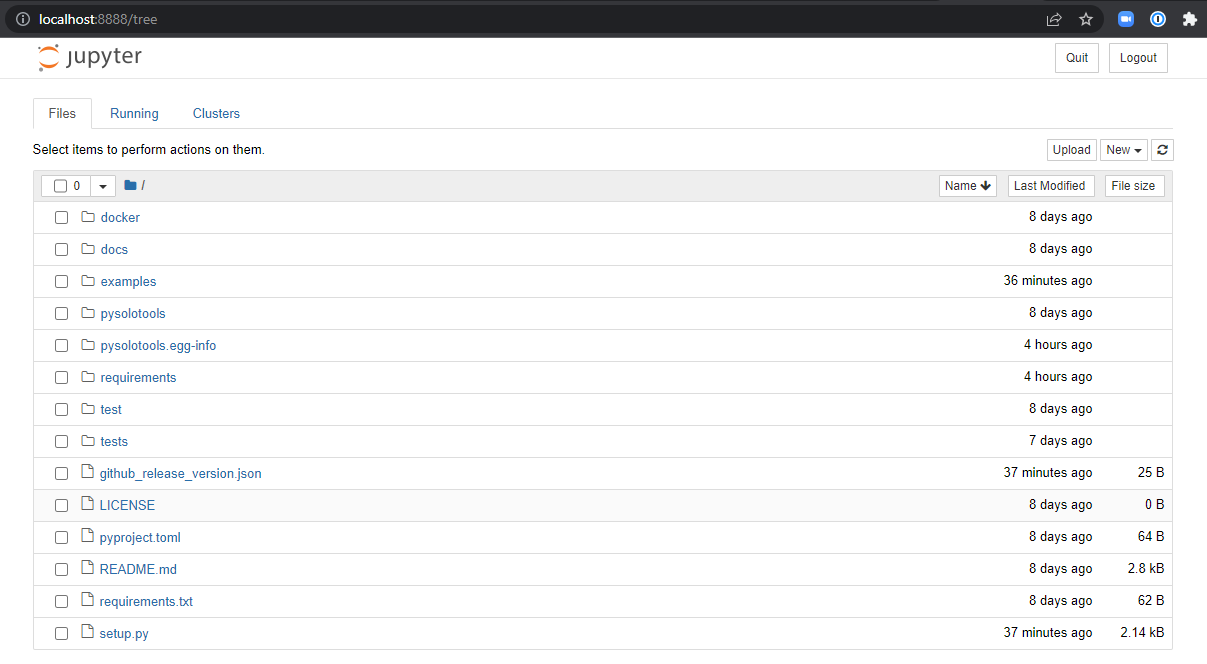
ℹ️ If your browser does not automatically start, you can point your browser to http://localhost:8888/
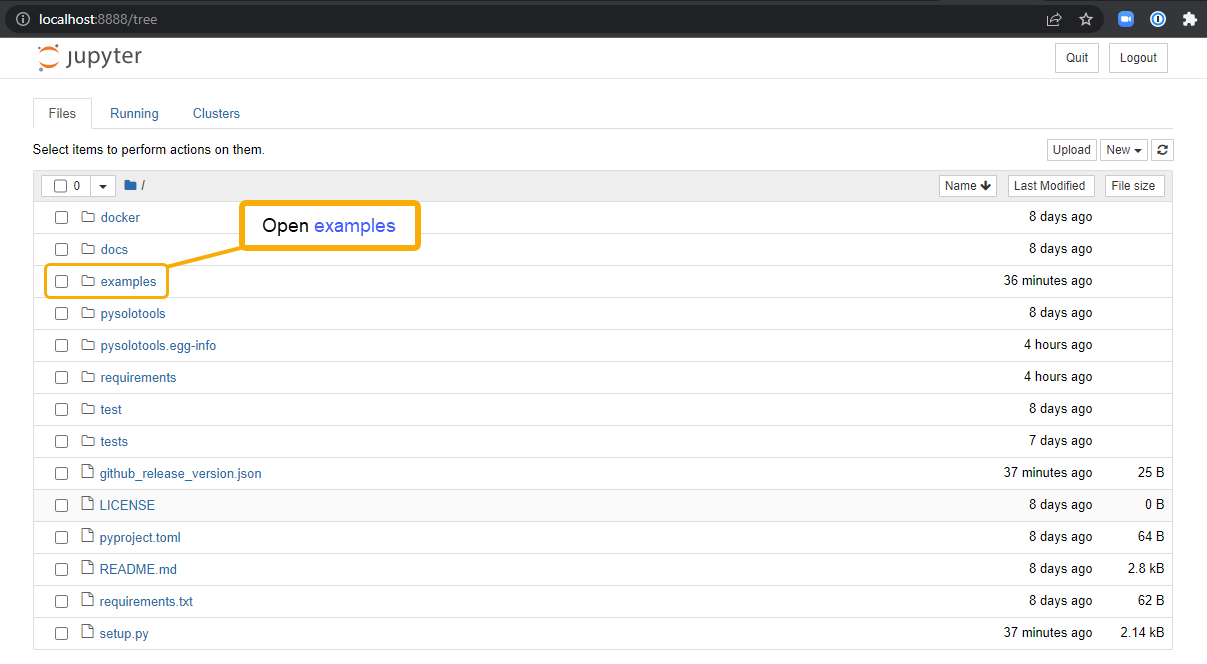
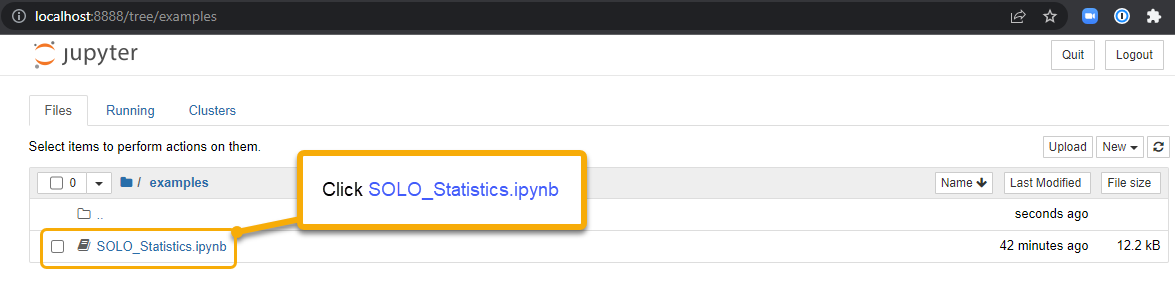
- 🟢 Action: Open the example stats notebook by clicking on examples and then SOLO_Statistics.ipynb
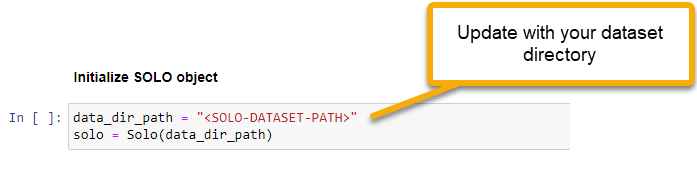
- 🟢 Action: Update the
Initialize SOLO objectcell to point to your SOLO dataset. Replace the<SOLO-DATASET-PATH>token between the quotes to your dataset path.
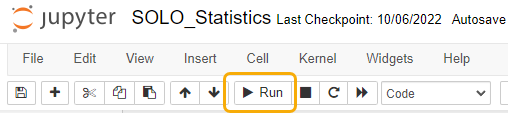
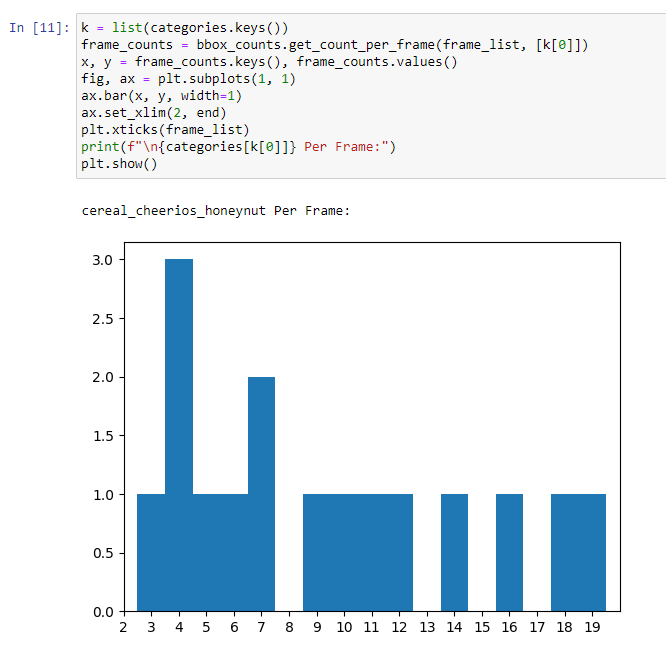
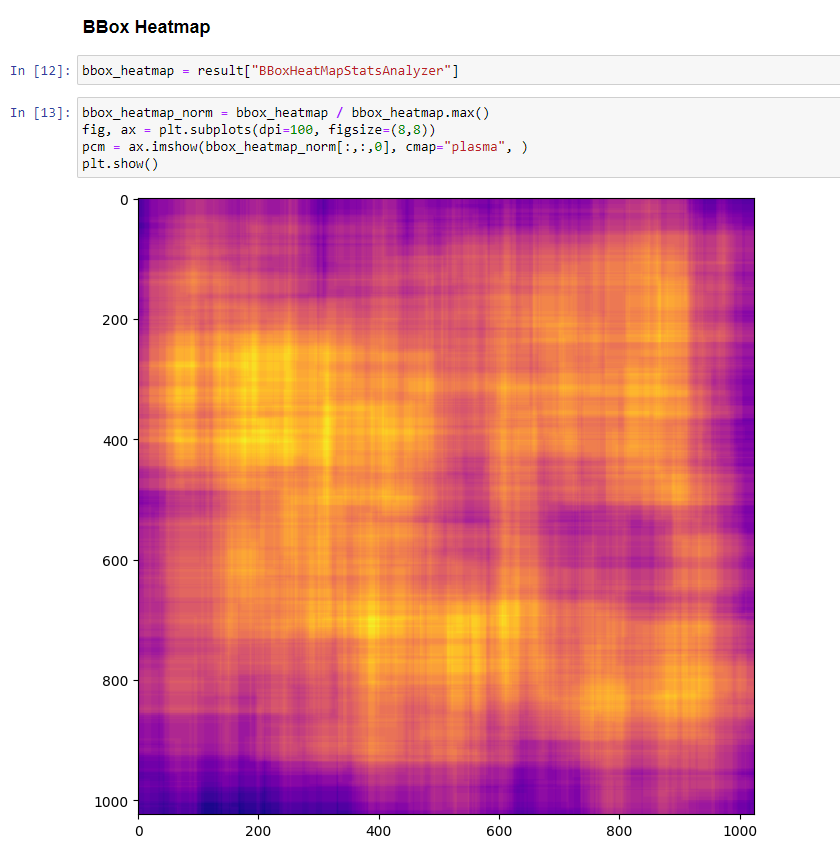
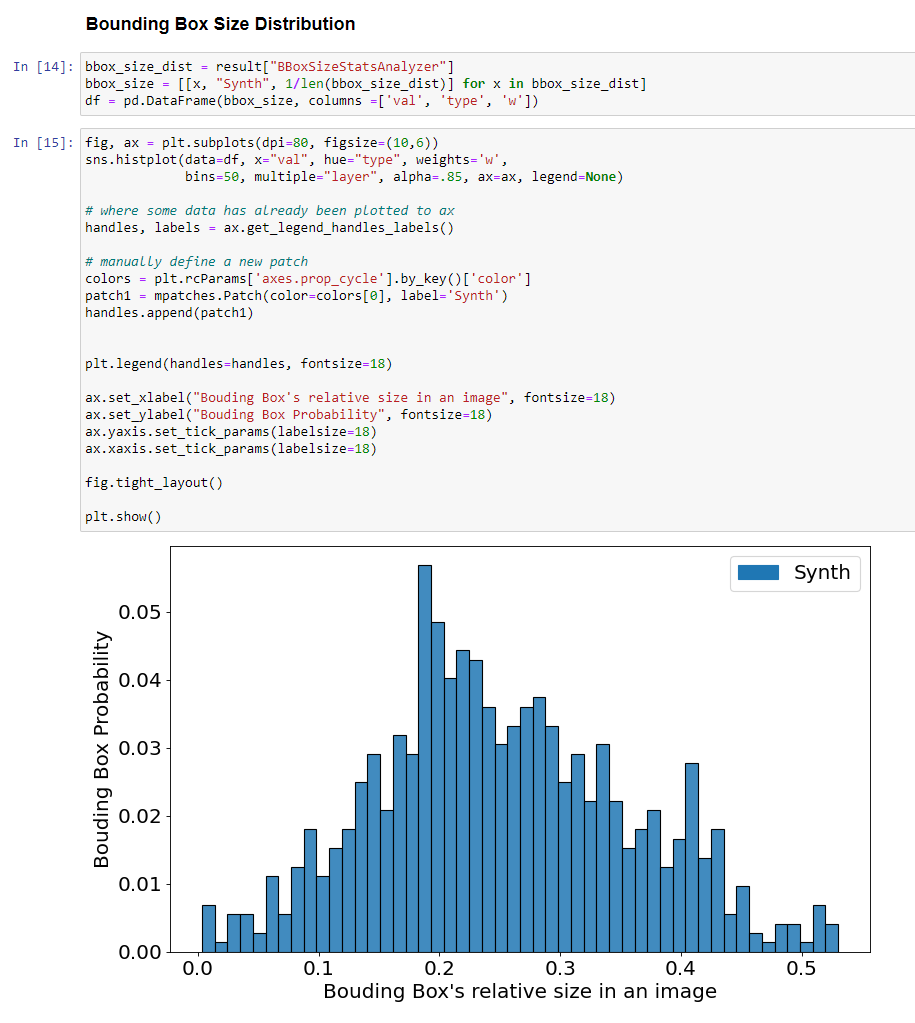
- 🟢 Action: Click the Run (▷) button to iterate through the notebook cells.
This concludes the Pysolotools Tutorial. In the next phase, we will use Voxel51 and the SOLO plugin to visually inspect the dataset.