Visualizing SOLO Datasets with Voxel51 and Pysolotools
An important step to validating your data is being able to visually inspect it. We have developed a custom SOLO importer to Voxel51 which allows for the visualization of all data and annotation types in SOLO. This tutorial will walk you through setting up your environment to use the pysolotools-fiftyone package, opening your data for viewing, and switching between label types. This guide will continue using the data generated in Phase 1 of the Synthetic Data Tutorial, but the Voxel51 viewer works with all SOLO datasets.
Setup
Set up your Python environment
The first thing that we will need to do is to setup our Python environment. This guide assumes that you already have Python 3.8 or higher installed on your machine.
To avoid a Python configuration nightmare, we highly recommend using a virtual Python environment for development. For this tutorial we will use Anaconda, but this is just a recommendation and not mandatory. For more information about Anaconda environments, and why you should use one, please see here.
- 🟢 Action: Download and install Anaconda or Miniconda on your local machine
- 🟢 Action: Create or reuse a virtual environment.
For this example we are naming our environment
pysolotools_env, but this name is up to you. If you have already created an environment from the previous step in the tutorial, you can reuse that environment (skip this step).
conda create --name pysolotools_env python=3.8
- 🟢 Action: Activate the new conda environment
conda activate pysolotools_env
Install OpenEXR
OpenEXR is a required Python library for pysolotools-fiftyone. OpenEXR requires system binaries to be built prior to installing the Python libraries. Please see the installation instructions here to help you install the OpenEXR binaries.
ℹ️ It is more difficult to install OpenEXR binaries on Windows than MacOS, Linux, or Windows WSL. Our team has been able to do this by downloading the prebuilt OpenEXR wheel file found here. Be sure to download the correct version for your Python environment. If you are using Python 3.8 then the OpenEXR-1.3.8-cp38-cp38-win_amd64.whl is probably the wheel file that you will need. Install the wheel file by running pip install OpenEXR-1.3.8-cp38-cp38-win_amd64.whl
- 🟢 Action: Install OpenEXR binaries
After installing the binaries, you can install OpenEXR Python package the same way that you would install any other Python package.
- 🟢 Action: Install openexr using pip with the following command
pip install openexr
Install pysolotools-fiftyone
- 🟢 Action: Install pysolotools-fiftyone using pip with the following command
pip install pysolotools-fiftyone
ℹ️ The above will not work until we go public. Until then you need to install pysolotools-fiftyone with
pip install pysolotools-fiftyone --index-url=https://artifactory.prd.it.unity3d.com/artifactory/api/pypi/pypi/simplethis info should be remvoed when we go public
Running Pysolotools-Fiftyone
We will now run pysolotools-fiftyone on the data that we generated previously.
- 🟢 Action: Execute pysolotools-fiftyone on your data
pysolotools-fiftyone <SOLO_PATH>
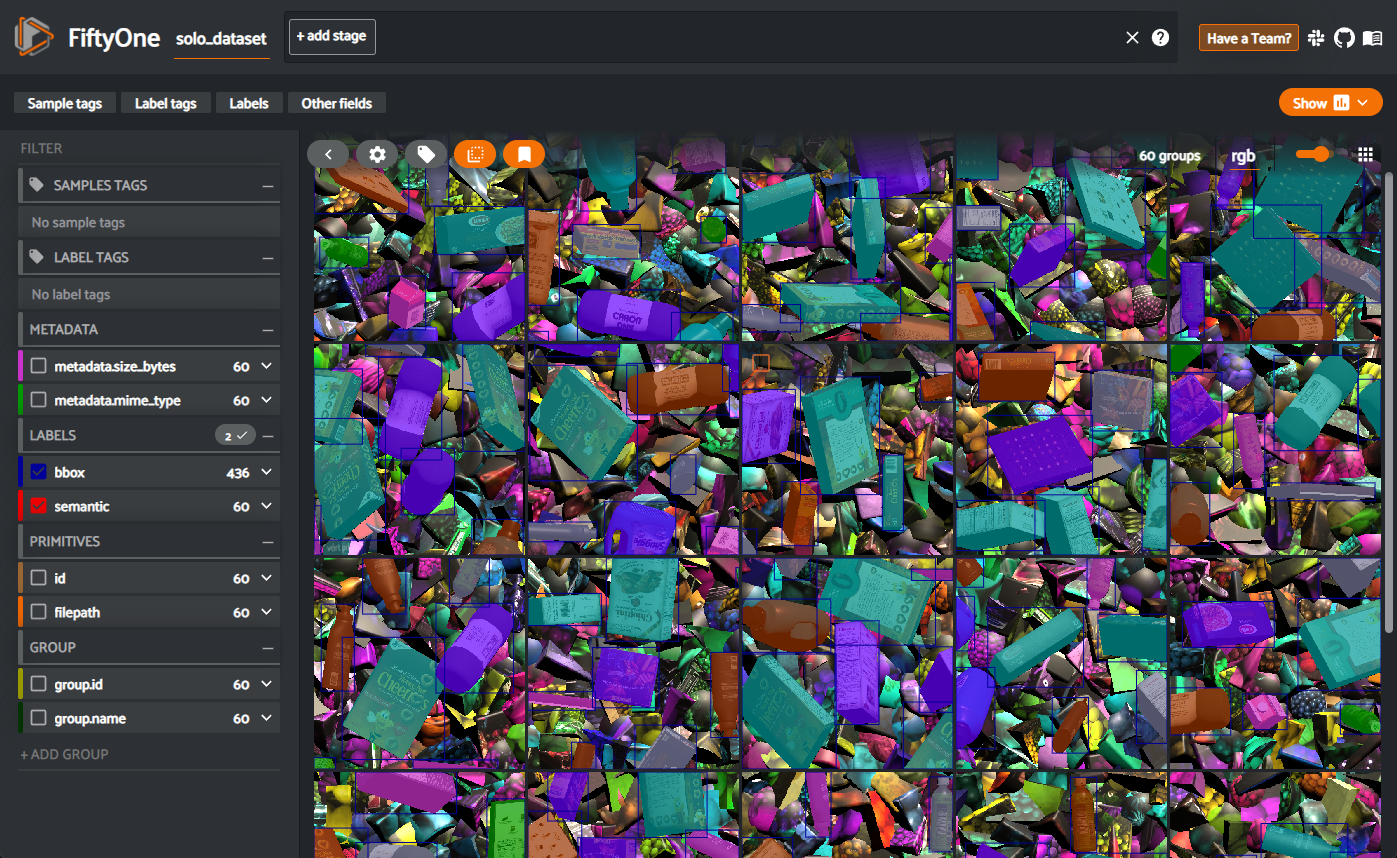
This will launch the fiftyone viewer in your default web browser. You should see a page similar to this:

By default all of the annotation types found in the dataset are on, which can be quite overwhelming visually. We can turn them off by clicking off the bbox and semantic labels under the LABELS tab on the left side column.
- 🟢 Action: Turn off visible annotations by clicking of the bbox and semantic labels
There will be a tile for each generated frame of your dataset. You can zoom in on a single frame by clicking the tile on the page.
- 🟢 Action: Click the tile in the upper left corner to zoom in on the first frame of the dataset
We will now look at the results of the individual Labelers by turning the labels back on. The first one we will look at is the results of the 2D bounding box Labeler.
2D Bounding Box Labeler
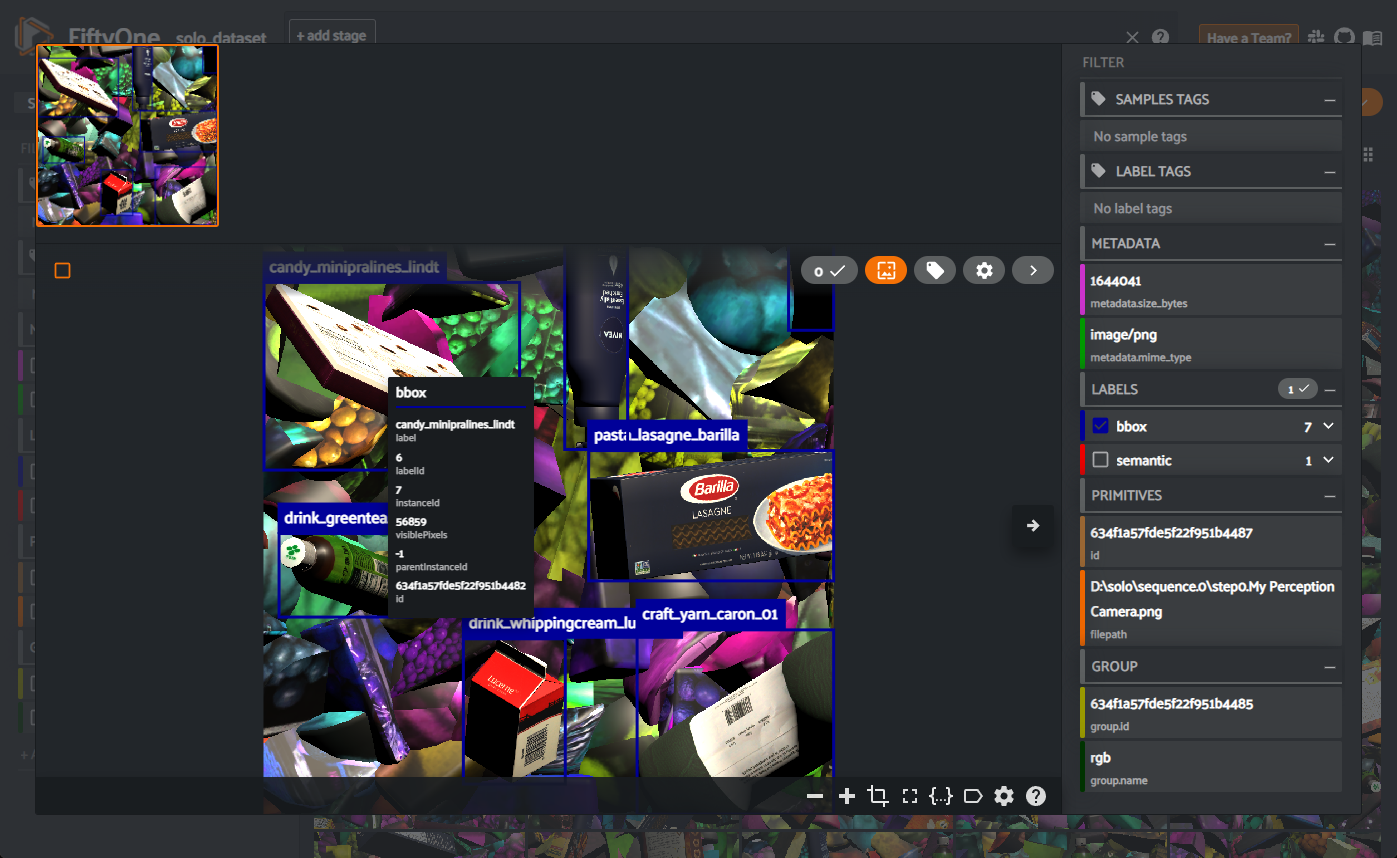
The 2D bounding box Labeler shows the bounding boxes and label names of all of the labeled foreground objects in the frame. You can get even more granular information about a labeled object by hovering your mousing pointer over its box. This will provide metadata information including label id, instance id, and visible pixels. Other information could be included in this pop-up depending on which Labelers were active during dataset generation.
- 🟢 Action: Enable the bbox Labeler by clicking the check box next to its name under the LABELS tab on the right side of the screen

Semantic Segmentation Labeler
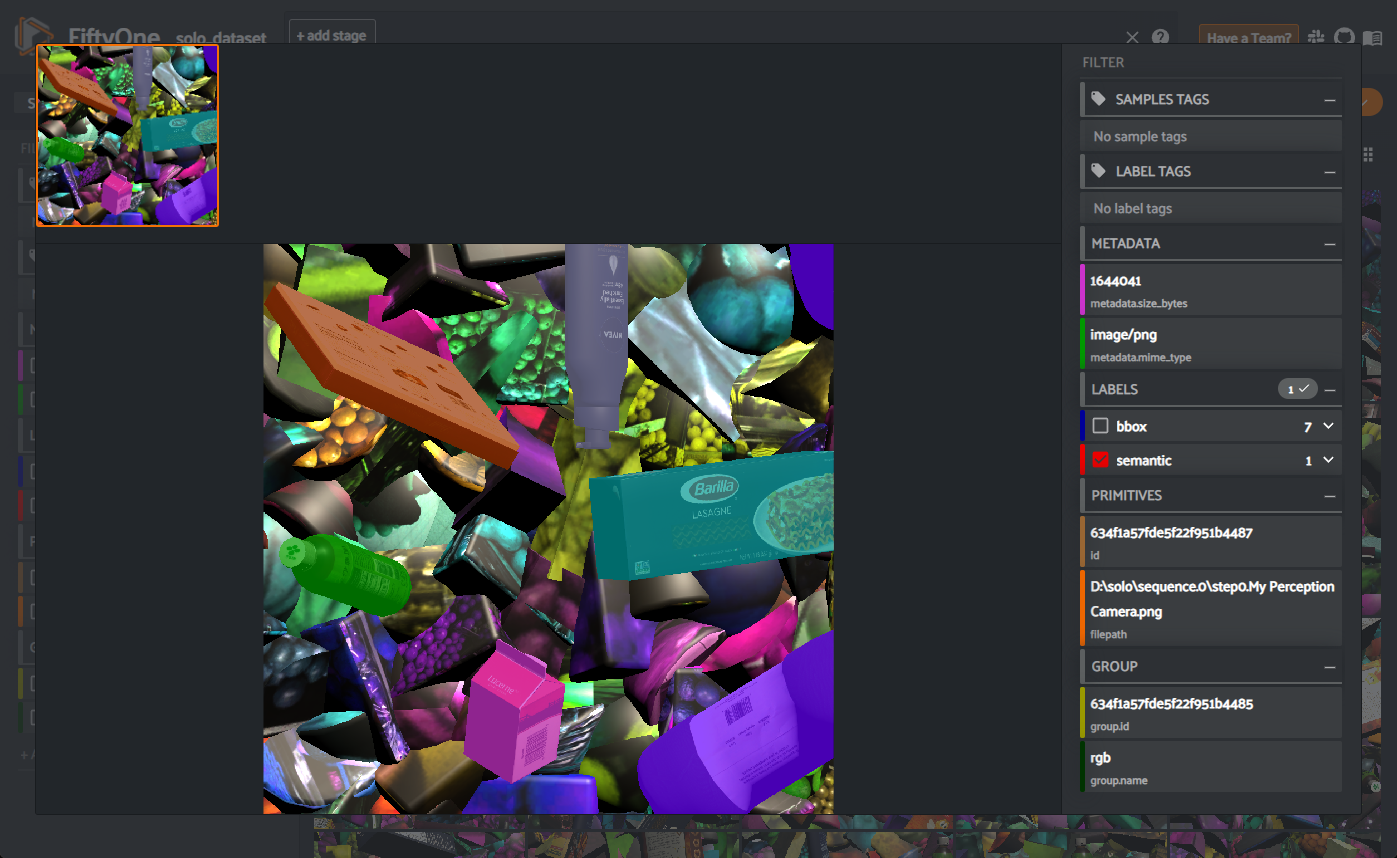
The semantic segmentation Labeler shows the identified types of objects by drawing each class of object with a color. These colors can be darkened by moving the slider found in the settings gear icon.
- 🟢 Action: Enable the semantic Labeler and disable the bbox Labeler by clicking the check box next to their names under the LABELS tab on the right side of the screen

In this tutorial we only looked at the 2D bounding box and semantic segmentation Labelers. The fiftyone viewer; however, supports all of the current Perception Labeler types including: 2D bounding box, 3DF bounding box, instance & semantic segmentation, keypoints, occlusion, depth, normals, and pixel position Labelers.