Use the Addressables Profiler module
You can use the Addressables Profiler module to inspect what content Addressables loaded. To open the Profiler, go to Window > Analysis > Profiler.
Prerequisites
- Build Reports must be enabled and the runtime being profiled requires a build report. To enable build reports, go to the Editor preferences, select Addressables preferences, then enable Debug Build Layout.
- Collecting information about the running content requires build time data collection information for the debug build layout. These files are stored in the folder
<Project Directory>/Library/com.unity.addressables/buildReports. Each build you make creates a new build report file in this directory. When running the Profiler, any incoming Profiler data from the Profiler target is synced and looks for the build report file for that runtime in thebuildReportsfolder. If the build report doesn't exist, such as if the project was built using a different machine, then the Profiler doesn't display the information for that data. Select Find in file system to open a file select window, which can you can use to locate a build report file on disk elsewhere. - The Profiler module doesn't support the Play Mode Scripts Use Asset Database (Fastest). The content must be built and using Use Existing Build based Play Mode Scripts.
Open the Profiler module
To open the Addressables Profiler module:
- Open the Profiler window (Window > Analysis > Profiler).
- In the top left of the Profiler window select the dropdown button labeled Profiler Modules.
- Enable the Addressable Assets module.
View the module
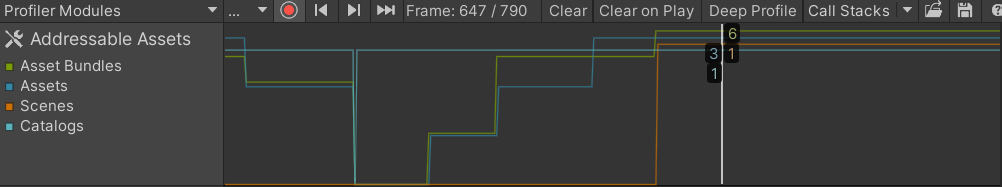
Use the module view can to track how many AssetBundles, assets, scenes, and catalogs are loaded at the frame in time.
The following screenshot displays three assets and one scene, from one catalog, and six AssetBundles:
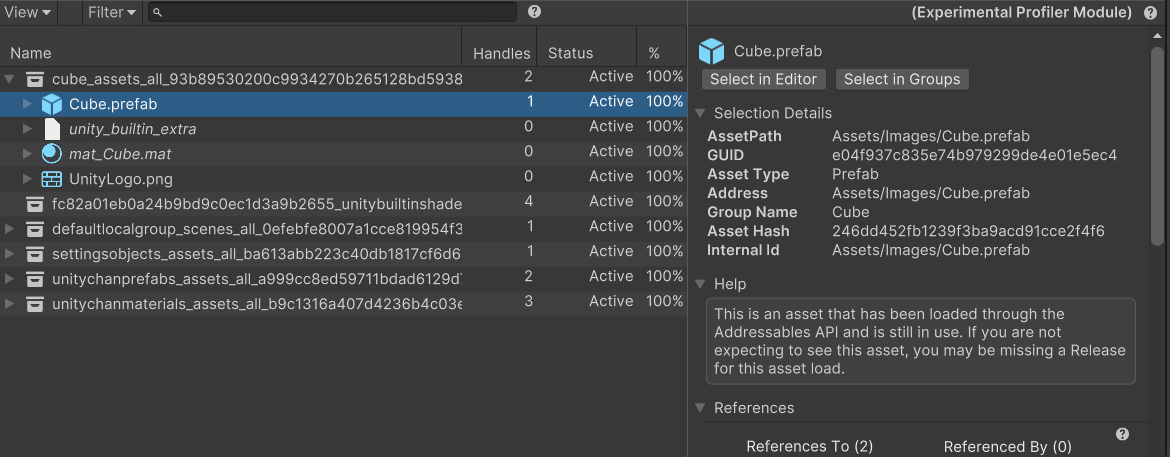
When you select a frame, the detail pane fills with information for that frame and displays a tree view for the loaded content.