Using Adaptive Performance samples
Adaptive Performance ships with samples to help you integrate all package functionality into your Project.
When you install the Adaptive Performance package, Unity automatically downloads its associated samples. Import these samples into your Project to understand example uses of the Adaptive Performance APIs as a starting point, and to test and verify results on your device.
Each sample logs information about the current state and any decisions being made in the system. The Android Logcat package is an excellent way to monitor current activity when using Adaptive Performance on Android. Each sample also defines its own end conditions and when these conditions are met, the application exits. You can find all messages, state changes, and temperatures in the log.
Installation
Install Adaptive Performance samples from the Package Manager window. Some samples require Universal Render Pipeline to work while others work with any render pipeline. The following samples are available for any render pipeline:
- Sample Environment
- Thermal Sample
- Bottleneck Sample
- Boost Sample
- Cluster Info Sample
- VRR Sample
- Automatic Performance Control Sample
- Adaptive Framerate Sample
- Adaptive LOD Sample
- Adaptive Resolution Sample
- Adaptive View Distance Sample
- Scaler Profiles Sample
- Custom Scaler Sample
- Adaptive Physics Sample
- Visual Scripting
- Adaptive Layer Culling
- Lifecycle Management
- Performance Mode
The following samples require Universal Render Pipeline to work:
- Adaptive Batching Sample
- Adaptive LUT Sample
- Adaptive MSAA Sample
- Adaptive Shadow Sample
- Adaptive Sorting Sample
- Adaptive Transparency Sample
- Adaptive Decals Sample
Note: Most Adaptive samples use the Scaler Visualization Prefab and let you see the status of the Scalers. To make the testing of this sample easier, you can modify the status by enabling or disabling the scaler and overriding the level through a slider in the UI instead of relying on the Indexer to control the level.
Sample environment
The sample environment is a prerequisite for most samples, because they share the same assets. You must install the sample environment before installing any other samples to have the necessary base structure available.
Thermal sample
The thermal sample shows how to register and respond to thermal state change events from the Adaptive Performance API. It also shows how to use the thermal API to query the current thermal state of the device.

The thermal states can be difficult to trigger when a device is sitting on a desk, because devices are designed to prevent overheating. To prevent heat loss on the device and see the effects of the thermal API, you might need to set the device on something warm or keep it in your hands.
The thermal sample is heavy on GPU usage to produce enough heat and then be able to cool down quickly to activate the warning levels.
- Nominal - The device is cool enough to operate at full CPU speed.
- Throttling Imminent - The device is heating up and trending toward the need to throttle the CPU and GPU soon to prevent overheating.
- Throttling - The device has overheated and the CPU and GPU speeds have been throttled until the temperate drops down to a safe level.
The sample also has sliders to indicate the current temperature trend and level. When the device reaches a throttling state, the sample will stop drawing most objects to begin a fast cool off period until it's trending back toward a nominal state.
Bottleneck sample

This sample demonstrates the use of the bottleneck detection API. Adaptive Performance can detect three bottleneck types: CPU, GPU, and target framerate.
The sample runs in a rotation of the three possible states:
- Targeting CPU Bottleneck - Disable GPU heavy tasks, enable CPU heavy tasks.
- Targeting GPU Bottleneck - Disable CPU heavy tasks, enable GPU heavy tasks.
- Targeting Framerate - Disable CPU and GPU heavy tasks.
While the sample runs, information about the bottleneck state is stored in a list of Marker structs. Each Marker contains the time, a label, and the number of objects that were active at that time. When the sample has finished running, all of the Markers are written to the log.
If the currently targeted bottleneck has been stable for at least 5 seconds, the system saves a Marker with the status information. After waiting 3 seconds to let the device settle, more information is saved, then test switches to the next bottleneck.
Options
The BottleneckControl Prefab in the Bottleneck scene enables you to configure several attributes of how the test operates:
| Option | Description |
|---|---|
| CPU and GPU loaders | These are Prefabs that will be spawned until the target bottleneck is reached. |
| Time Out | How long (in seconds) to wait for each bottleneck to be reached before switching to the next one. |
| Wait Time Before Switch | How many seconds before starting the next part of the test. |
| Wait Time After Target Reached | How long to wait (in seconds) after meeting the target bottleneck. |
| State Change Iterations | How many times the sample iterates through each bottleneck type. |
Boost sample
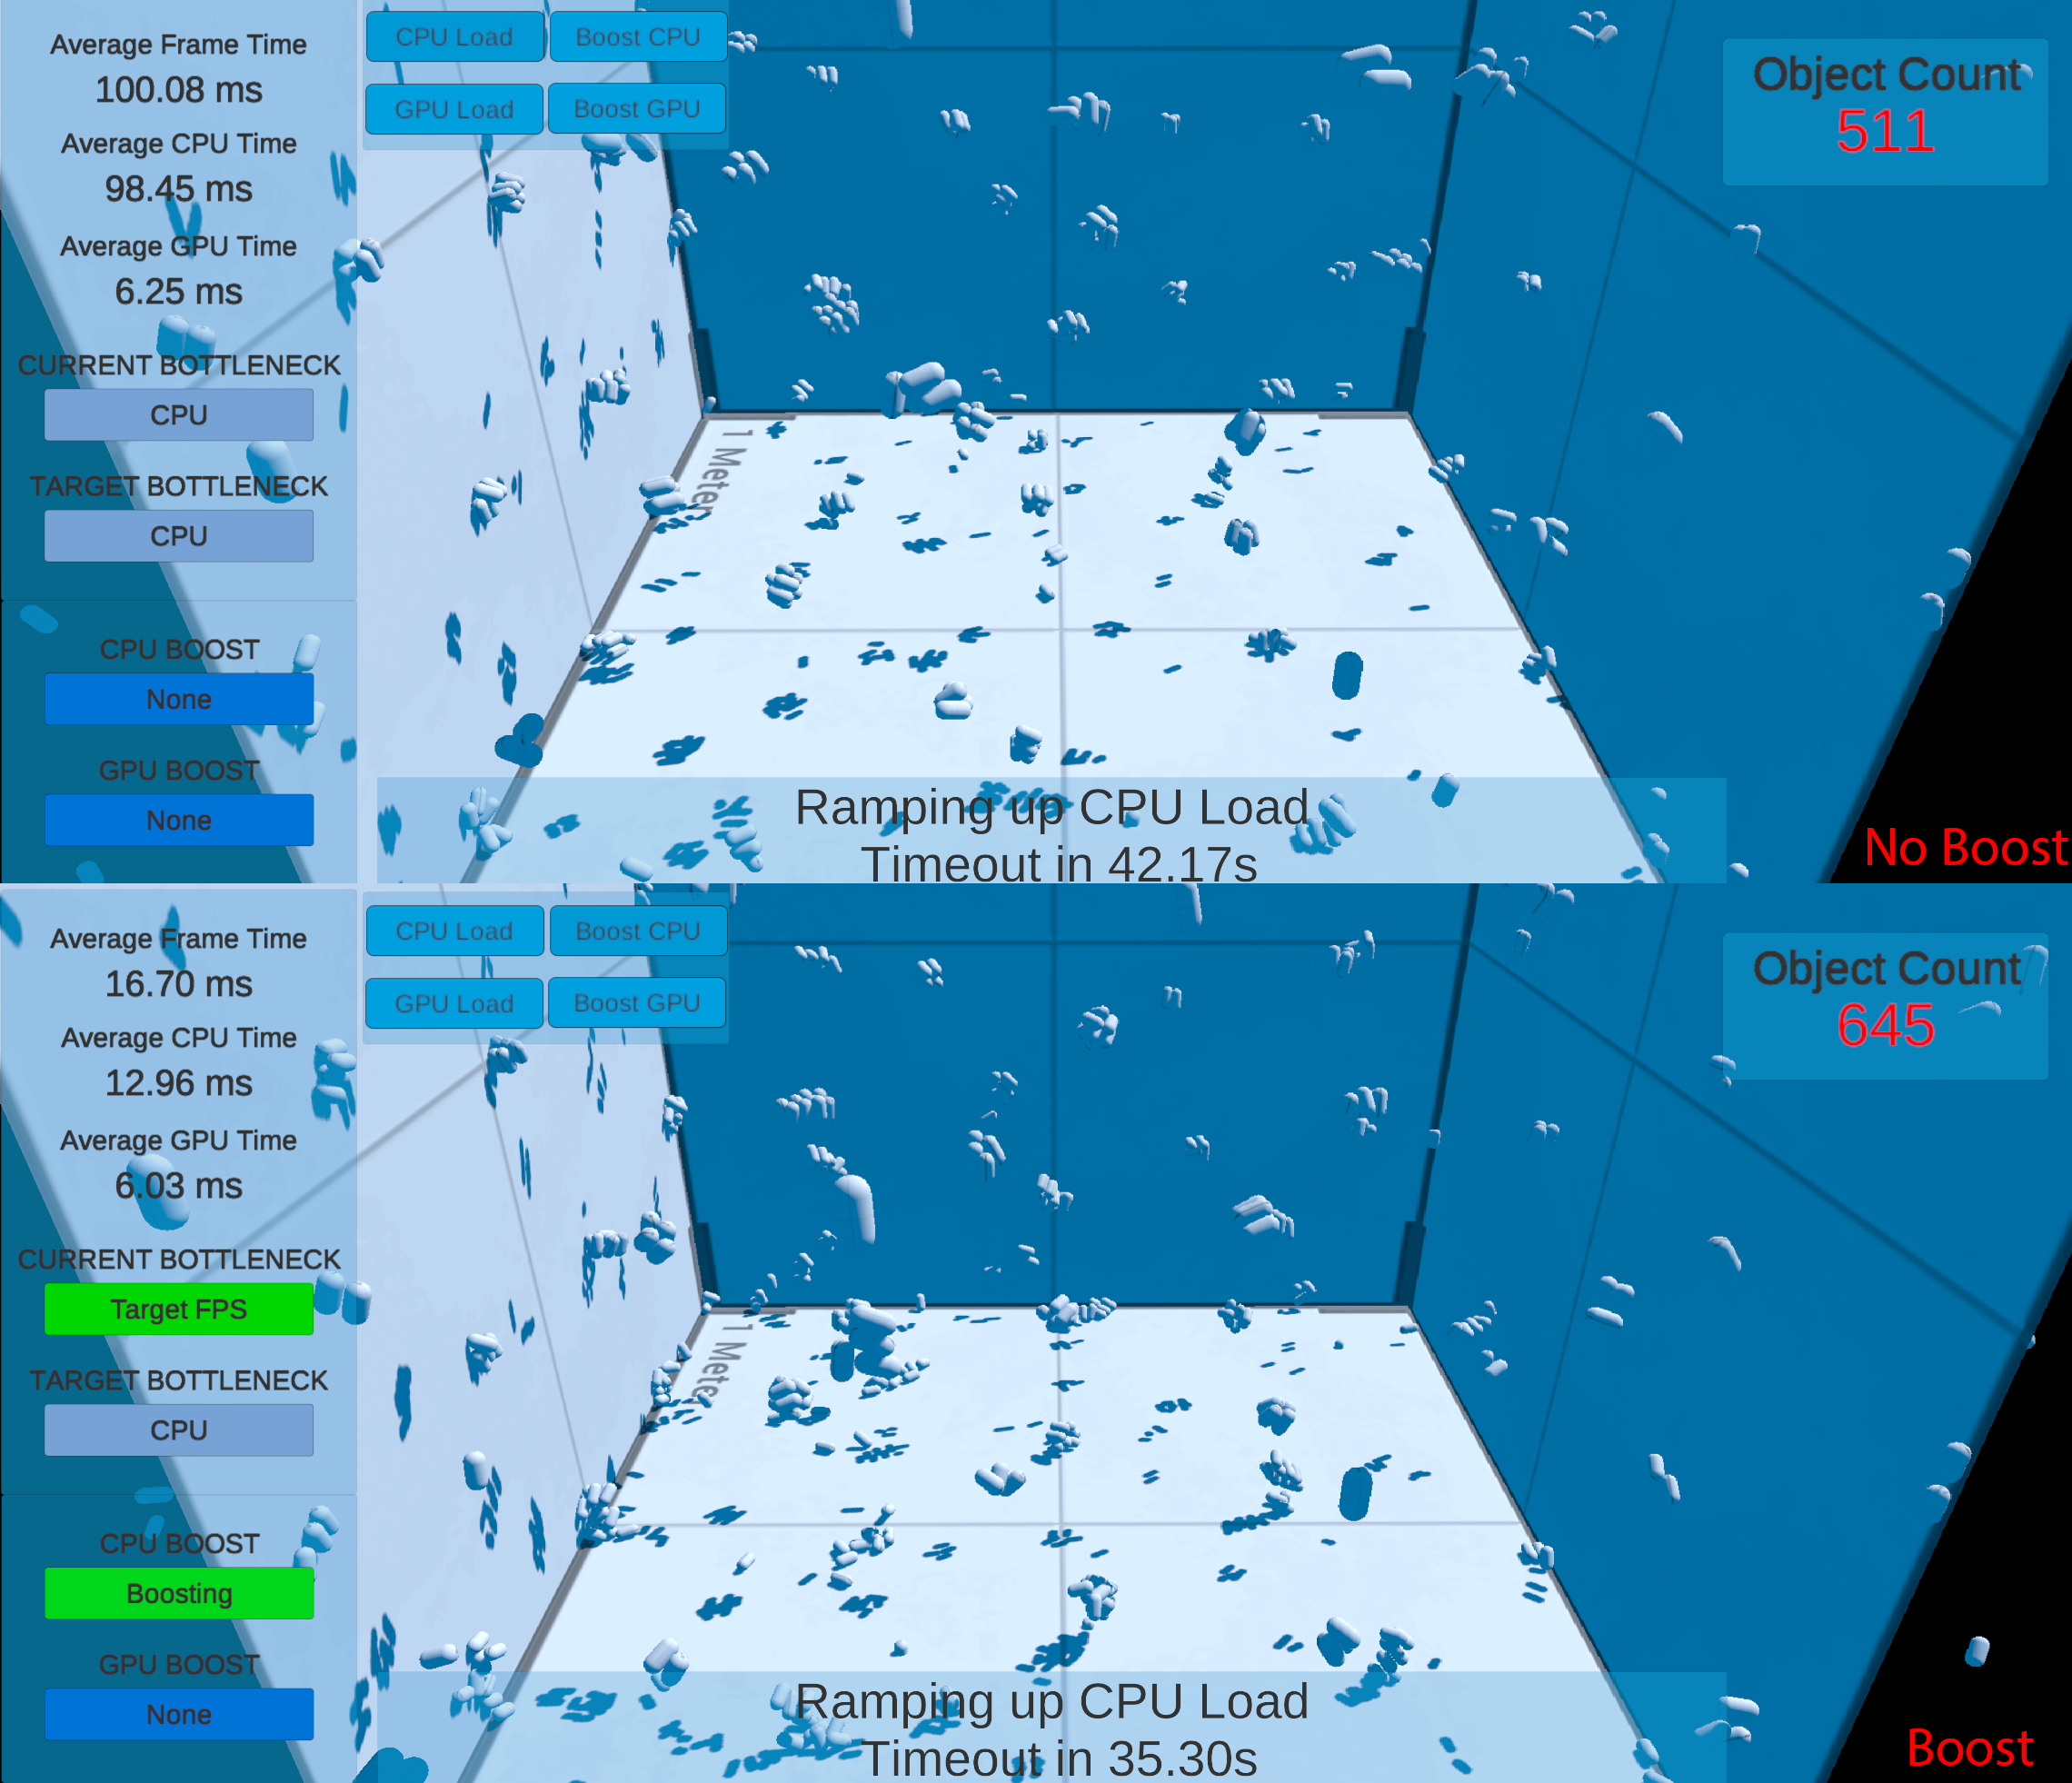
This sample demonstrates the use of the CPU and GPU boost API. Adaptive Performance can request a CPU or GPU boost which changes the minimum and maximum frequency of the CPU or GPU to provide more resources to the CPU and GPU.
The sample has buttons to activate the CPU and GPU boosts and simulate high CPU or GPU load.
The scene spawns bees. The log prints the time, and the number of bees spawned.
When you simulate a high load, you can see the CPU time or GPU frame time increase. When you activate boost mode, you can see the CPU or GPU frame time reduce for 10 seconds.
Using boost mode with CPU load generally increases the number of bees spawned.
Cluster Info sample

This sample demonstrates the use of the Cluster Info feature.
CPU cores come in different sizes and configurations on heterogeneous systems. This sample prints the number of big, medium and little cores to the log. It also demonstrates how to check if a feature, such as Cluster Info, is available. The sample prints Not Supported in red to the screen if the API isn't available or not supported.
VRR sample

Some devices are capable of changing the screen's refresh rate through device settings or at runtime with Adaptive Performance. This sample shows the moving objects with a dropdown menu to change the refresh rate. This is particularly helpful if you want to know how the refresh rate affects the smoothness of motion on the screen. The slider lets you adjust the target framerate.
At lower refresh rates, the motion of the objects might appear a little choppy, but you can make it smoother by increasing the screen's refresh rate.
Notes
- The only device that supports Variable Refresh Rate is the Samsung S20+ with GameSDK 3.2 or later.
- This demo requires the Samsung (Android) provider to be installed.
Automatic Performance Control sample

The Automatic Performance Control sample shows how the Adaptive Performance works using the two prefabs that have a medium and high CPU load respectively. Both scenes target 60 FPS and attempt to keep the framerate stable. If the device reports that throttling is imminent, the sample drops the framerate to 45 and Adaptive Performance automatically reduces the load on the device until it cools down and stops throttling.
The AutomaticPerformanceControl scene has an AutoPerfControl Prefab that allows you to modify the parameters for the test:
| Option | Description |
|---|---|
| High Level, Mid Level and No Load | References to Prefabs which are used for each test stage. |
| Test Timeout | Time in seconds for the test to run. |
| Auto Control Mode | You can disable the Adaptive Performance auto mode to see what effect the system has on thermal and bottleneck performance. |
| State Text | Reference to the UI Text element to display status. |
| Logging Active | A toggle to enable or disable logging. |
| Logging Frequency | The interval between writing messages to the log, in seconds. |
The TestSequence component has some additional options for configuring how the tests run:
| Option | Description |
|---|---|
| Auto Mode | The test loops through the defined sequence until the device reaches the Throttling Imminent thermal state at which point target FPS is set to 45. The timeout is defined in the Auto Perf Control component. |
| Test Sequence | The order in which test levels should load, and how long they should run, in seconds. |
Adaptive Framerate sample
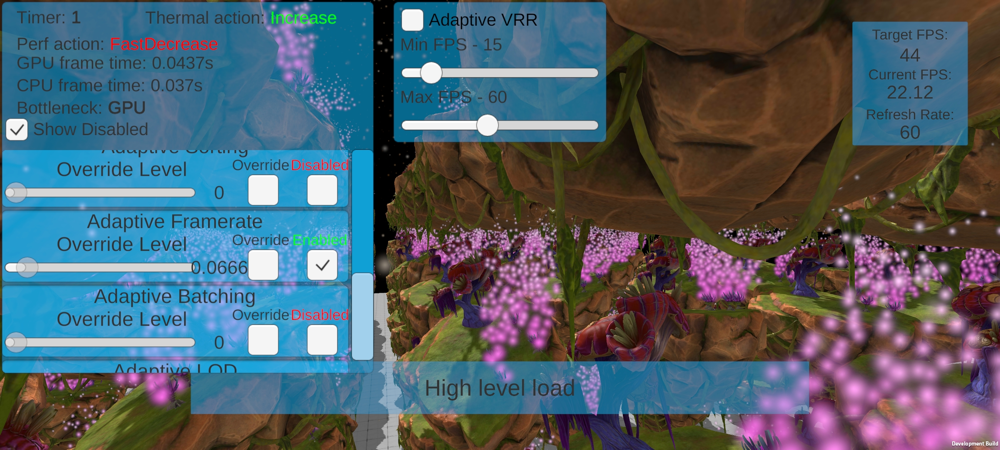
The Adaptive Framerate sample shows how to adjust the framerate dynamically at runtime.
This feature uses the Indexer system to make decisions on when and how much to increase or decrease the framerate to maintain performance and thermal stability.
The sample uses the same content as the Auto Performance Control sample. It switches between high and medium CPU load while using no load for 15 seconds in-between each load set to allow the framerate to come back up.
Options
The Adaptive Framerate sample uses the Scaler Visualization Prefab and enables you to view the status of the Scalers.
To adapt framerate automatically, use the Adaptive Framerate and Adaptive Variable Refresh Rate Scalers.
By default, no Scaler is enabled and you need to enable Adaptive Framerate and/or Adaptive Variable Refresh Rate. Each of those Scalers has a different purpose.
You can switch between Adaptive Framerate and Adaptive Variable Refresh Rate using the check box at the top of the sample. In addition, you can use the sliders below the checkbox to limit the framerate range that the scaler will adjust to.
In the sample scene, you can see Target FPS decreasing during the CPU and GPU heavy portions and rising back up when the load is decreased.
| Scaler | Description |
|---|---|
| Adaptive Framerate | Uses Application.TargetFramerate for managing the framerate between minimum and maximum framerate. |
| Adaptive Variable Refresh Rate | Uses VRR on supported devices to set VRR close to the achievable framerate defined between minimum and maximum framerate of the Adaptive Framerate settings. Adaptive VRR is based on Adaptive Framerate and will change the Application.TargetFramerate to the maximum framerate. |
Both scalers share the same setting. Adaptive Framerate settings are available in the Adaptive Performance settings. Adaptive VRR is using the same base settings as Adaptive Framerate and if you change them for Adaptive Framerate it also changes them for adaptive VRR. It's recommended to always use Adaptive VRR in combination with Adaptive Framerate and use the same settings. To change Adaptive VRR settings, you can either change the Adaptive Framerate settings or use C# API shown in AdaptiveFrameRateSettings.cs.
Note This demo requires the Samsung (Android) provider to be installed if you want to use Adaptive VRR.
Adaptive Resolution Sample

The Adaptive Resolution sample shows how to adjust the resolution dynamically at runtime. It uses the Indexer system to make decisions on when and how much to increase or decrease the resolution to maintain performance and thermal stability.
Note: On a Render Pipeline, the Adaptive Resolution sample is only supported on Vulkan. If you don't use Vulkan and use Universal Render Pipeline, it will fallback and use the Render Scale. The sample shows that as the device heats up and the Thermal action is set to Decrease, the resolution of the image on screen decreases and doesn't look as clear and sharp.
The overdraw control allows you to render multiple instances of the image on top of each other to increase the amount of GPU work and warm up the device faster.
Adaptive LOD sample
The Adaptive LOD sample shows how to adjust the lod bias dynamically at runtime. It uses the Indexer system to make decisions on when and how to increase or decrease the lod bias to maintain performance and thermal stability.
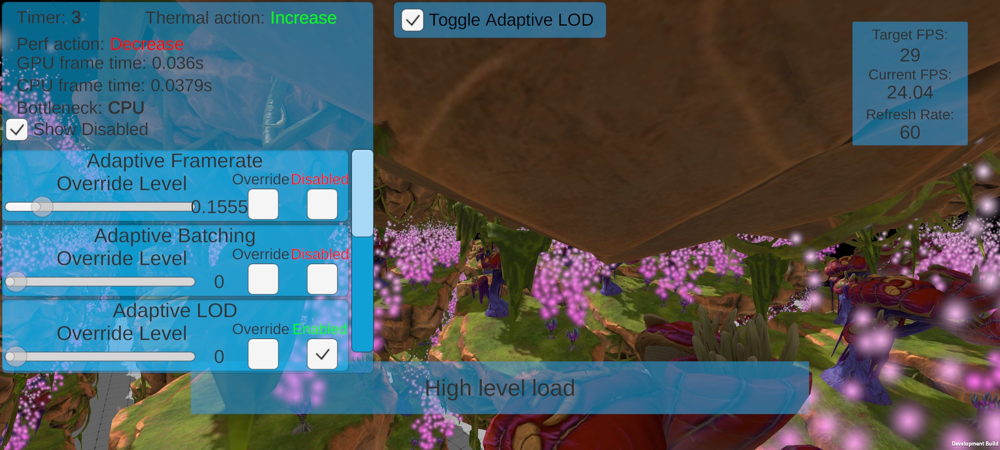
The Adaptive LOD sample uses the same content as the Auto Performance Control sample. It switches between high and medium CPU load while using no load for 15 seconds in-between each load set to allow the framerate to come back up.
Adaptive Batching sample
The Adaptive Batching sample shows how batching can be adjusted dynamically at runtime. It uses the Indexer system to make decisions on when and how to change batching to maintain performance and thermal stability.

Because changes aren't visible on-screen for this demo, use a graphics performance analyzer to see the differences.
Adaptive LUT sample
The Adaptive LUT sample shows how the LUT size can be adjusted dynamically at runtime.
This feature uses the Indexer system to make decisions on when and how much to increase or decrease the LUT to maintain performance and thermal stability.

The Adaptive LUT sample also shows color grading quality change when LUT size is adjusted. With smaller LUT size less graphics memory is consumed, but the color gradient transitions quality is reduced. This scaler work only with internal LUT generated from color grading effects. YOu can't us this scaler with External LUT texture supplied for Color Lookup post processing effect.

Options
The Adaptive LUT sample uses the Scaler Visualization Prefab and enables you to view the status of the Scalers. You can modify the status for easier testing by enabling or disabling the scaler and overriding the level via a slider in the UI instead of relying on the Indexer to control the level.
Adaptive MSAA sample
The Adaptive MSAA sample shows how MSAA can be adjusted dynamically at runtime. This feature uses the Indexer system to make decisions on when and how much to increase or decrease MSAA to maintain performance and thermal stability.

The scaler affects only camera's post processing and subpixel morphological Anti-aliasing (SMAA) quality level.

Adaptive Shadow Sample
The Adaptive Shadow sample shows how Shadow Distance, Shadow Cascades, Shadow Resolution and Shadow Distance can be adjusted dynamically at runtime. This feature uses the Indexer system to make decisions on when and how much to increase or decrease the different shadow features to maintain performance and thermal stability.

The sample uses the same content as the Auto Performance Control sample. It switches between high and medium CPU load while using no load for 15 seconds in-between each load set to allow the framerate to come back up.
In the sample, you can see the resolution of and distance at which shadows are rendering based upon the CPU and GPU load.
Adaptive Sorting Sample
The Adaptive Sorting sample shows how to use sorting dynamically at runtime. This feature uses the Indexer system to make decisions on when to change sorting to maintain performance and thermal stability.
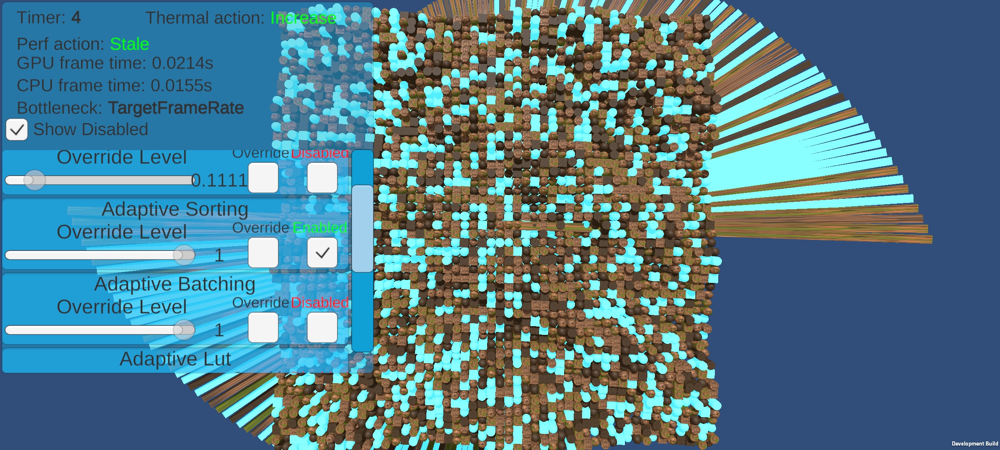
Note: As changes aren't visible on-screen for this demo, use a graphics performance analyzer to see the differences. For example, in the Editor Stats you can see a change in SetPass calls.
Adaptive Transparency sample
The Adaptive Transparency sample shows how to disable rendering of all transparent objects. This feature uses the Indexer system to make decisions on when to disable transparent objects rendering to maintain performance and thermal stability.

Adaptive View Distance sample
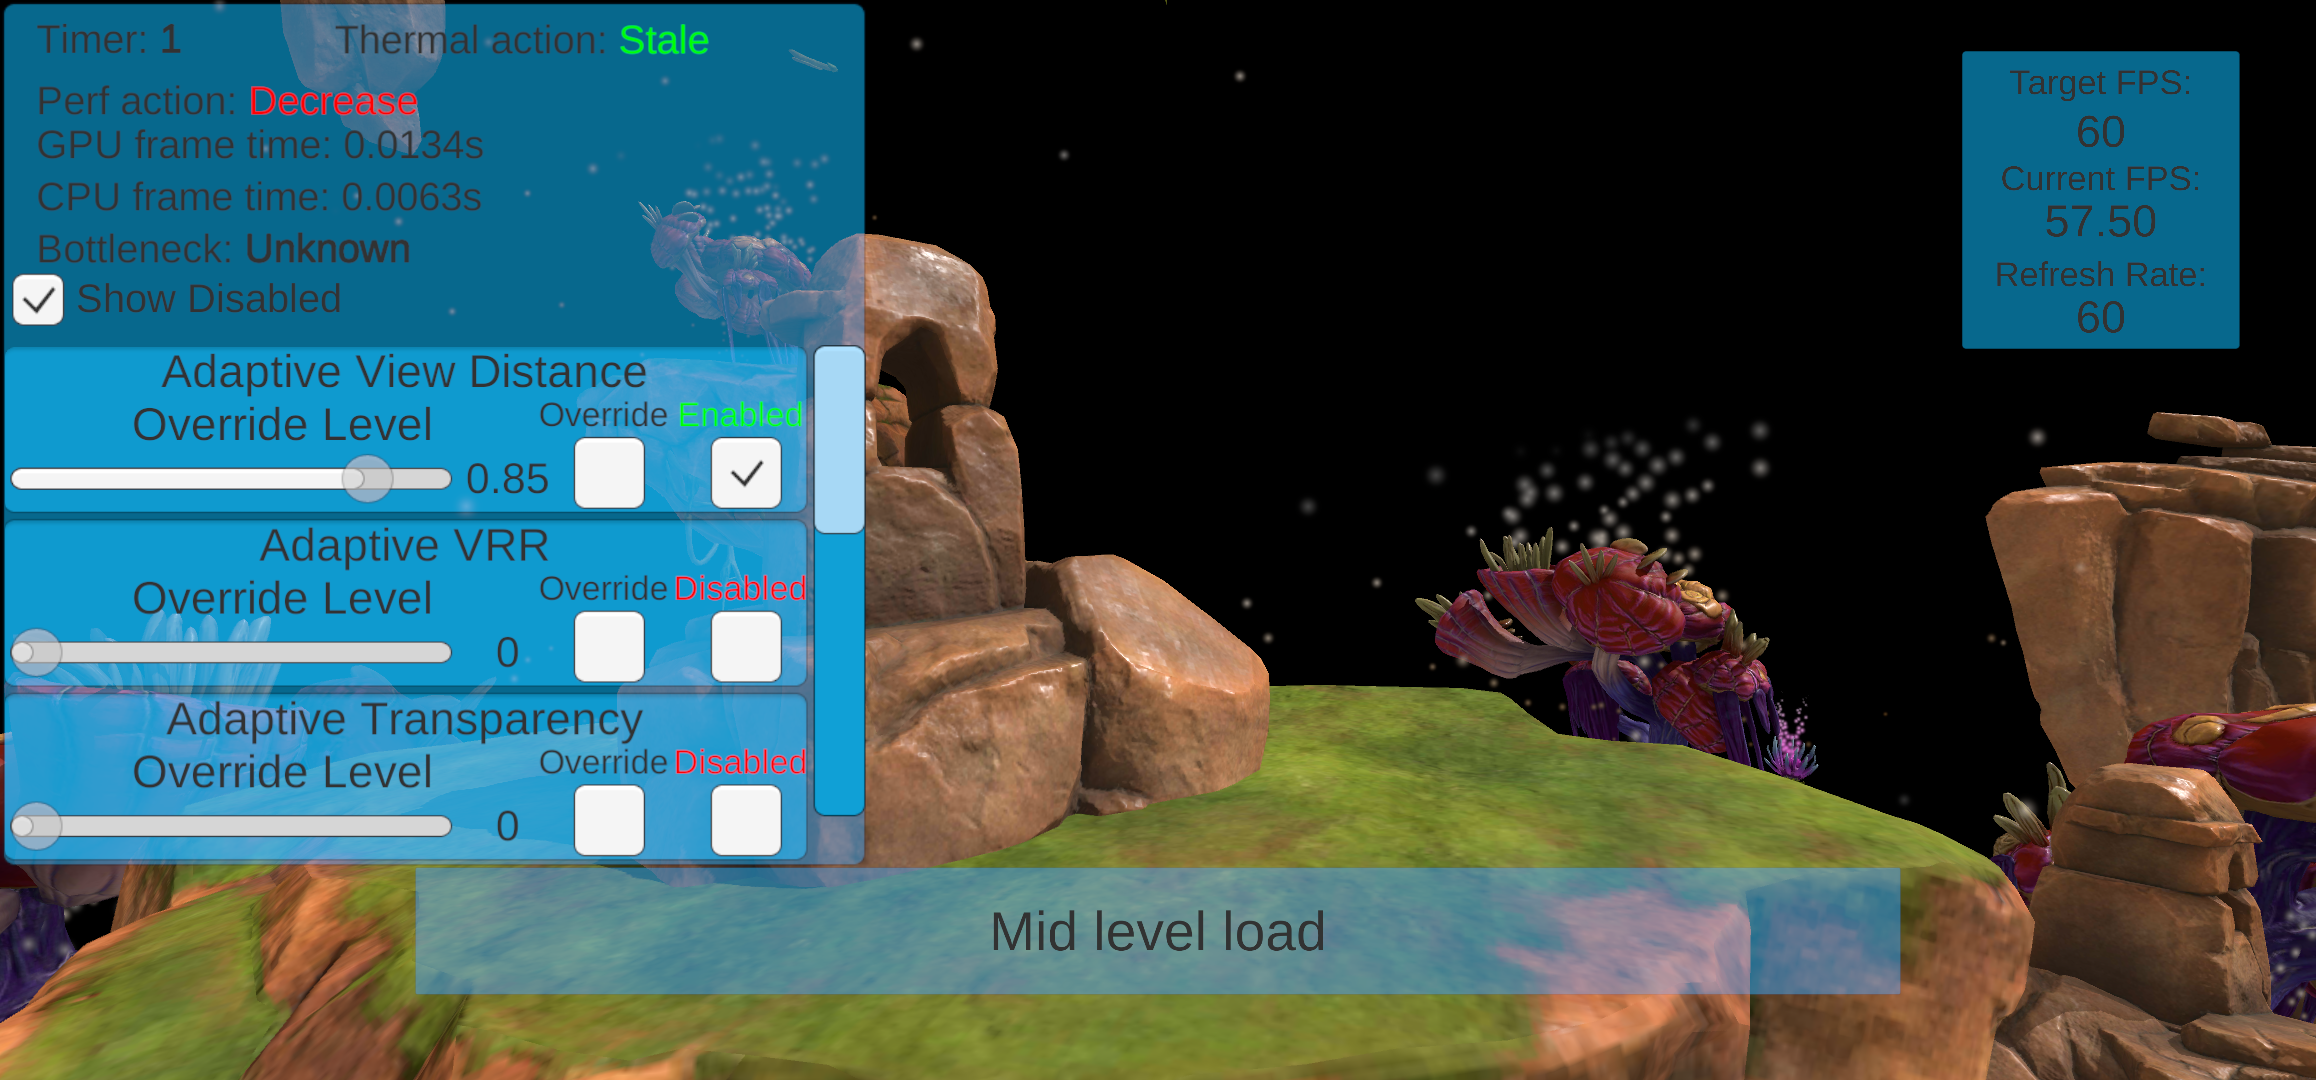
The Adaptive View Distance sample shows how to change the view distance of the main camera. To use the scaler, your main camera must be tagged with the tag MainCamera. This feature uses the Indexer system to make decisions on when reduce the view distance to maintain performance and thermal stability.
Scaler Profiles sample
The Scaler Profiles sample shows how you can use different scaler profiles to easily change scalers at runtime using the scaler profiles APIs.
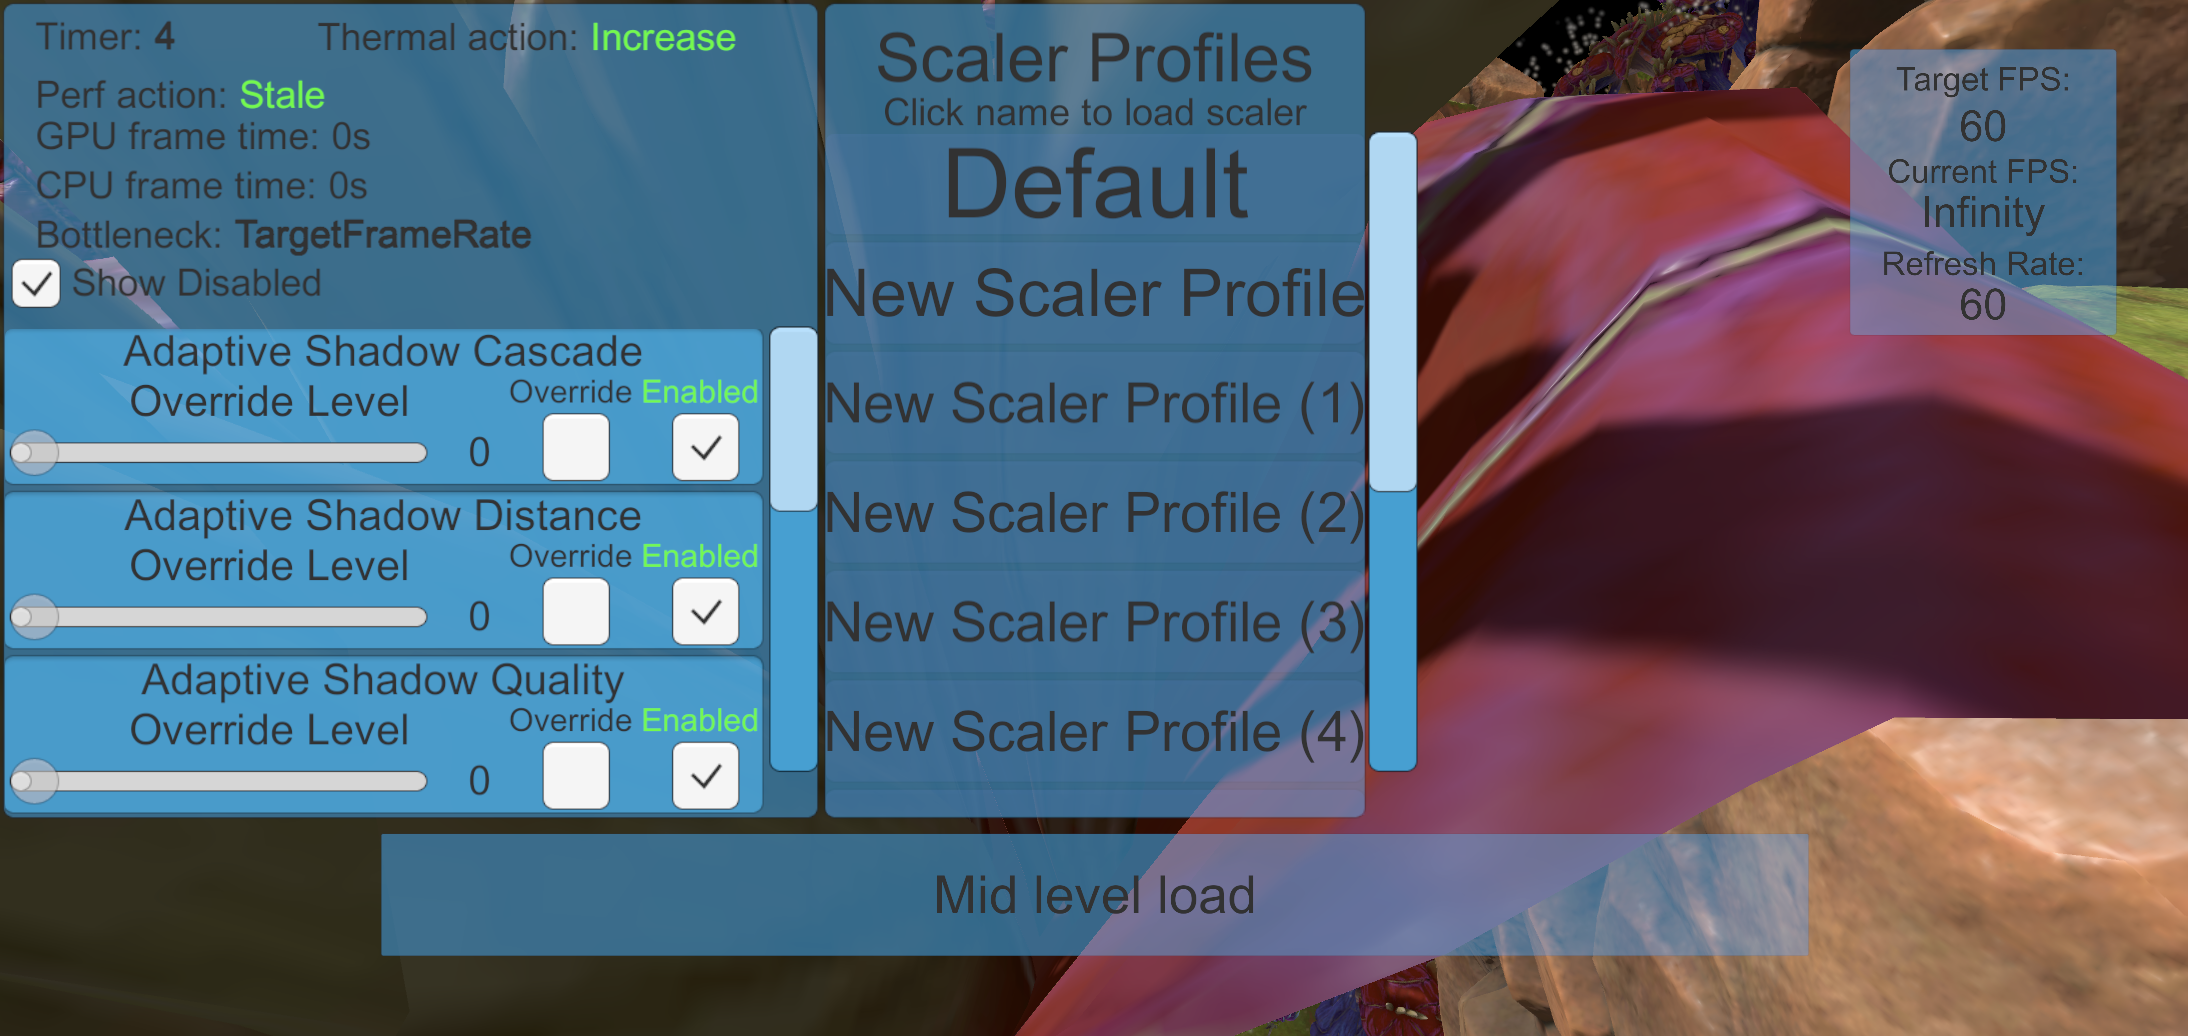
This demo only works if you add more than the default scaler profile. You can add different scaler profiles in the Adaptive Performance settings.

The scaler profiles UI shows the list of scaler profiles defined in the settings. To update all scalers defined in the profile, click the name of a scaler.
Custom Scaler sample
The Custom Scaler sample shows how to create a custom scaler that implements an adaptive fog. The scaler changes the view distance of the main camera uses linear fog to hide the cut-off.
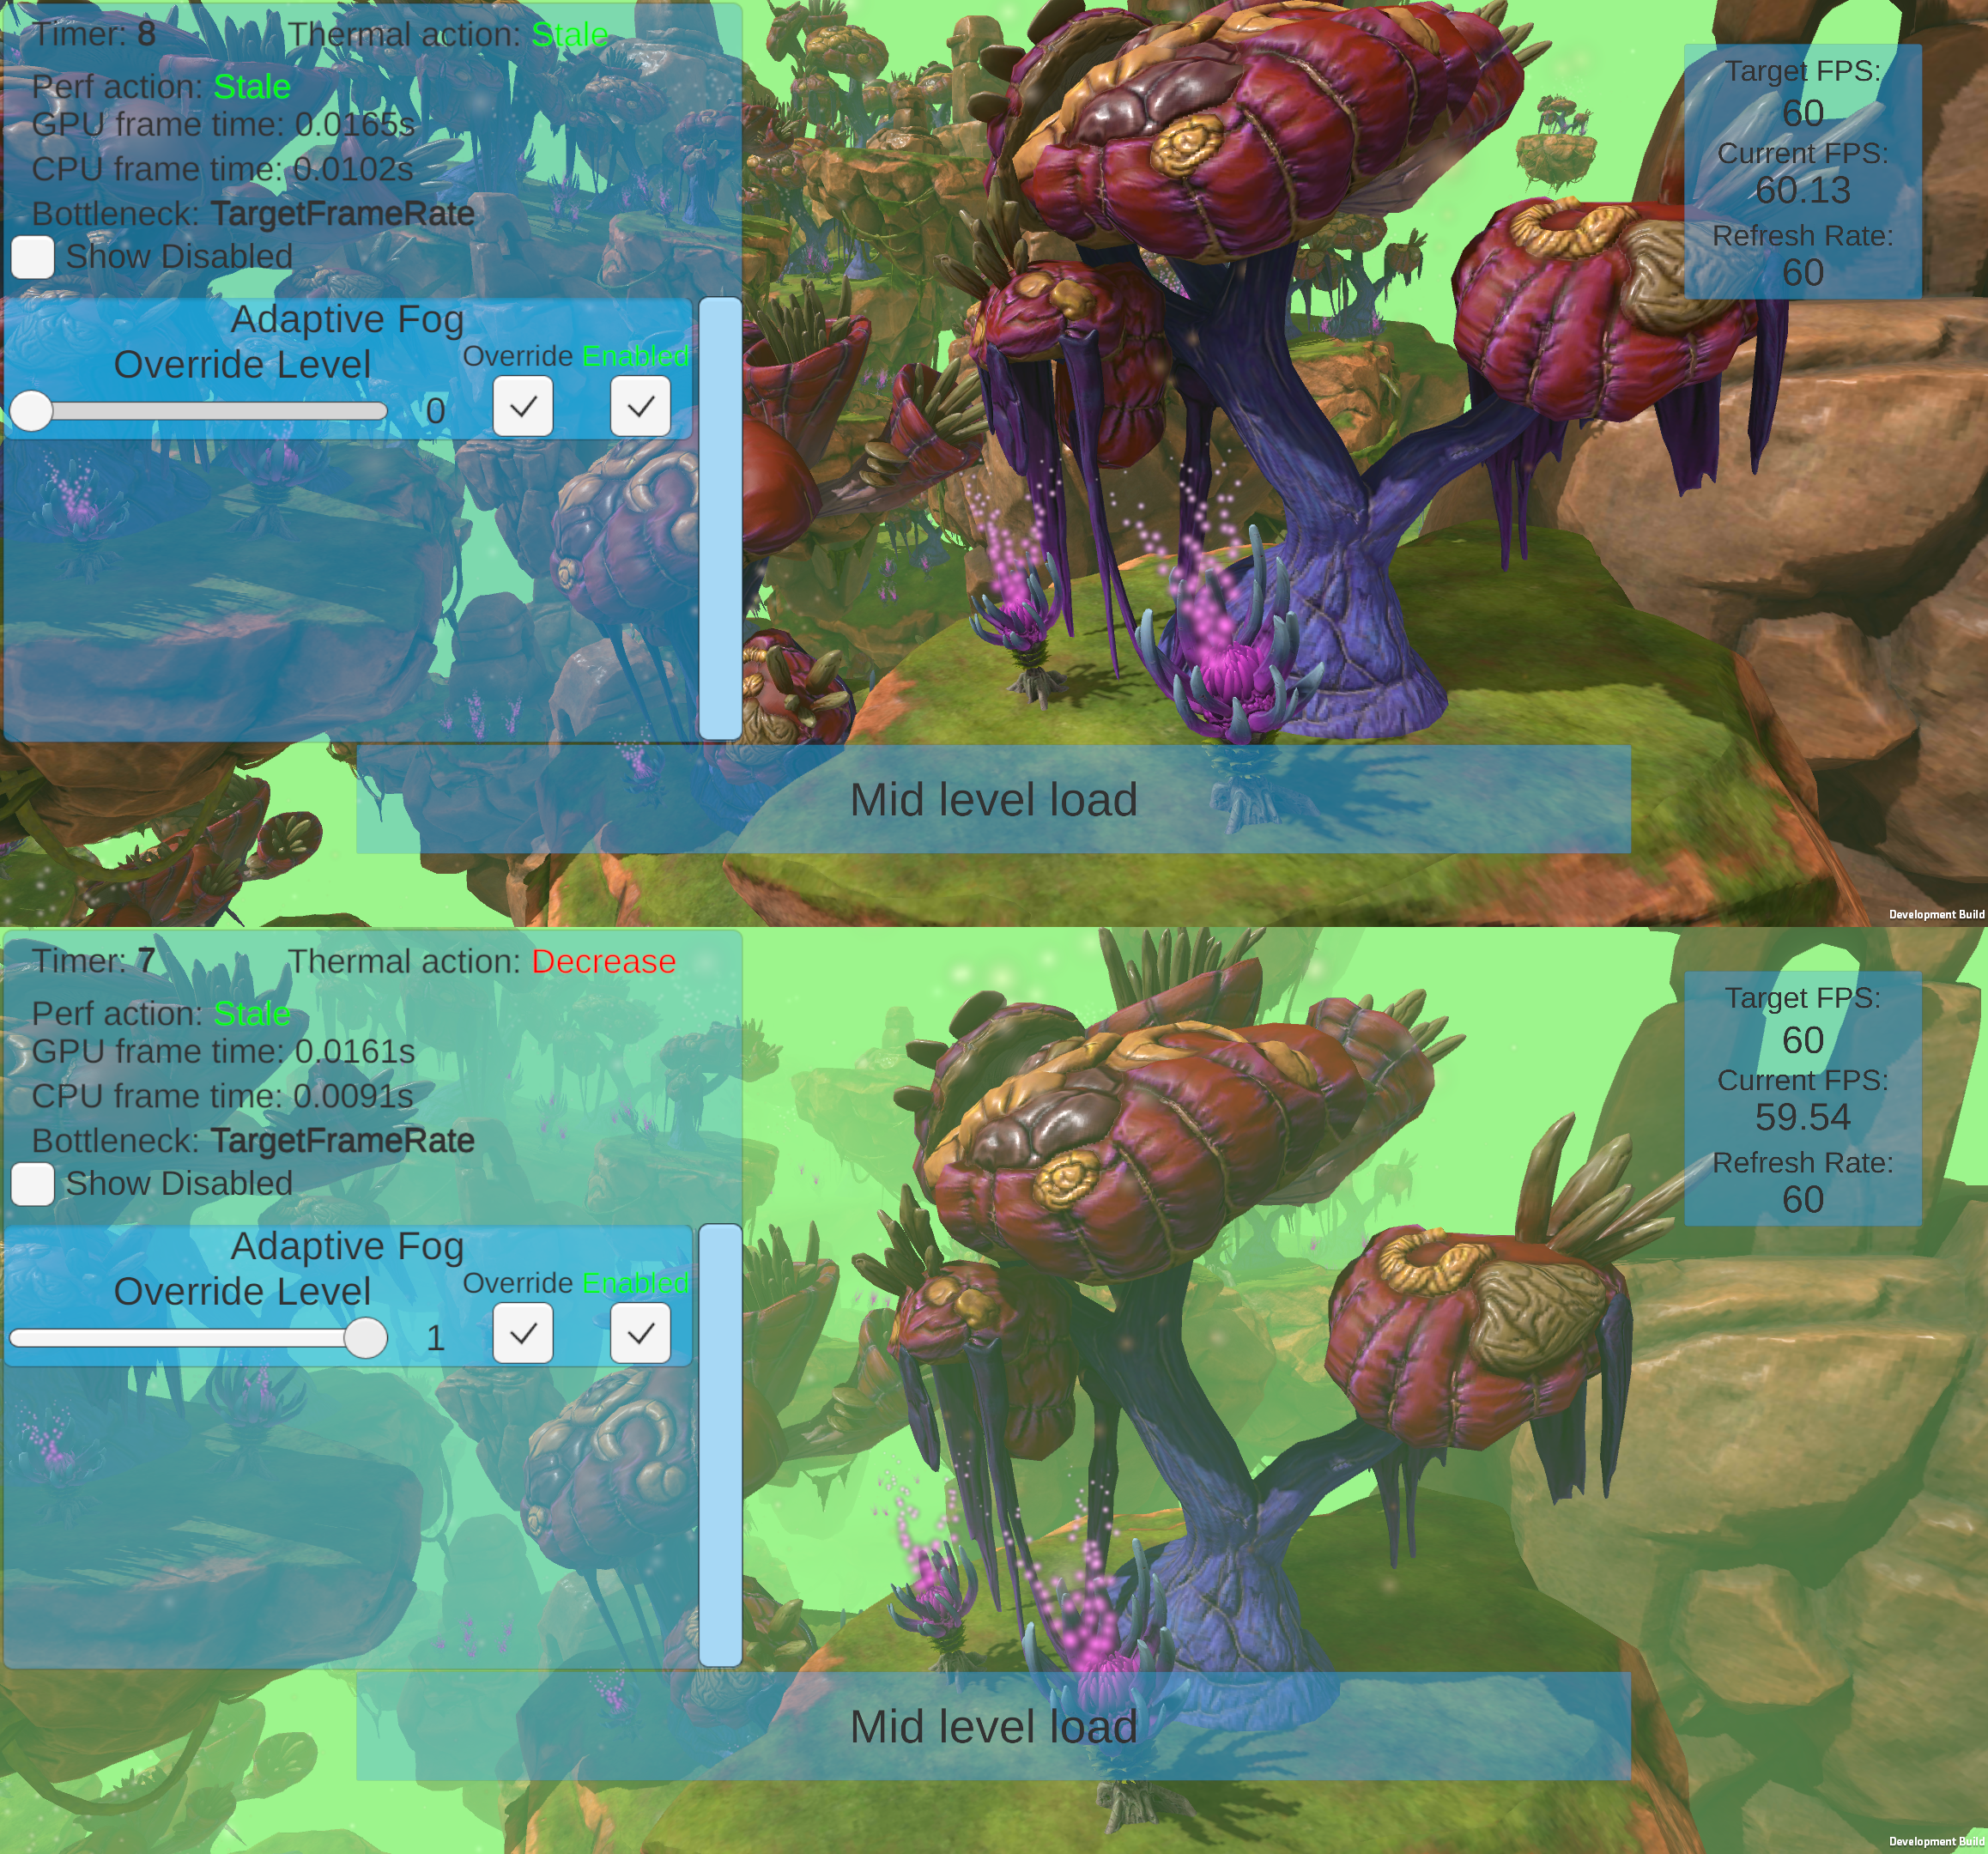
To use the scaler, add the MainCamera tag to be main camera in the scene. If you use exponential fog, the scaler changes the fog density until the fog disappears completely.
You can switch between Exponential and Linear Fog in the Settings. (menu: Lighting > Environment > Other Settings > Mode). The scaler's behavior changes depending on which fog mode you use:
- Exponential Fog: Reduces the density of the fog with every scale step until the fog disappears completely.
- Linear Fog: Changes the fog's End distance to coincide with the camera's view distance. This hides the reduced view distance with fog.
Note: Custom scaler don't appear in the UI list because the settings are hardcoded in the custom scaler class. The scalar initiates automatically and shows up in the device simulator, but you can't access it via scaler profiles.
This feature uses the Indexer system to make decisions on when to increase the fog and when to reduce the view distance to maintain performance and thermal stability.
Adaptive Physics
The adaptive physics sample shows how to change the fixed delta time at which the Physics engine updates. The physics scaler changes the fixed delta time and if you use it for other systems those will be scaled as well. If you use the fixed delta times in other systems you might want to create your own physics scaler, tweaking more detailed settings instead of the fixed delta time.
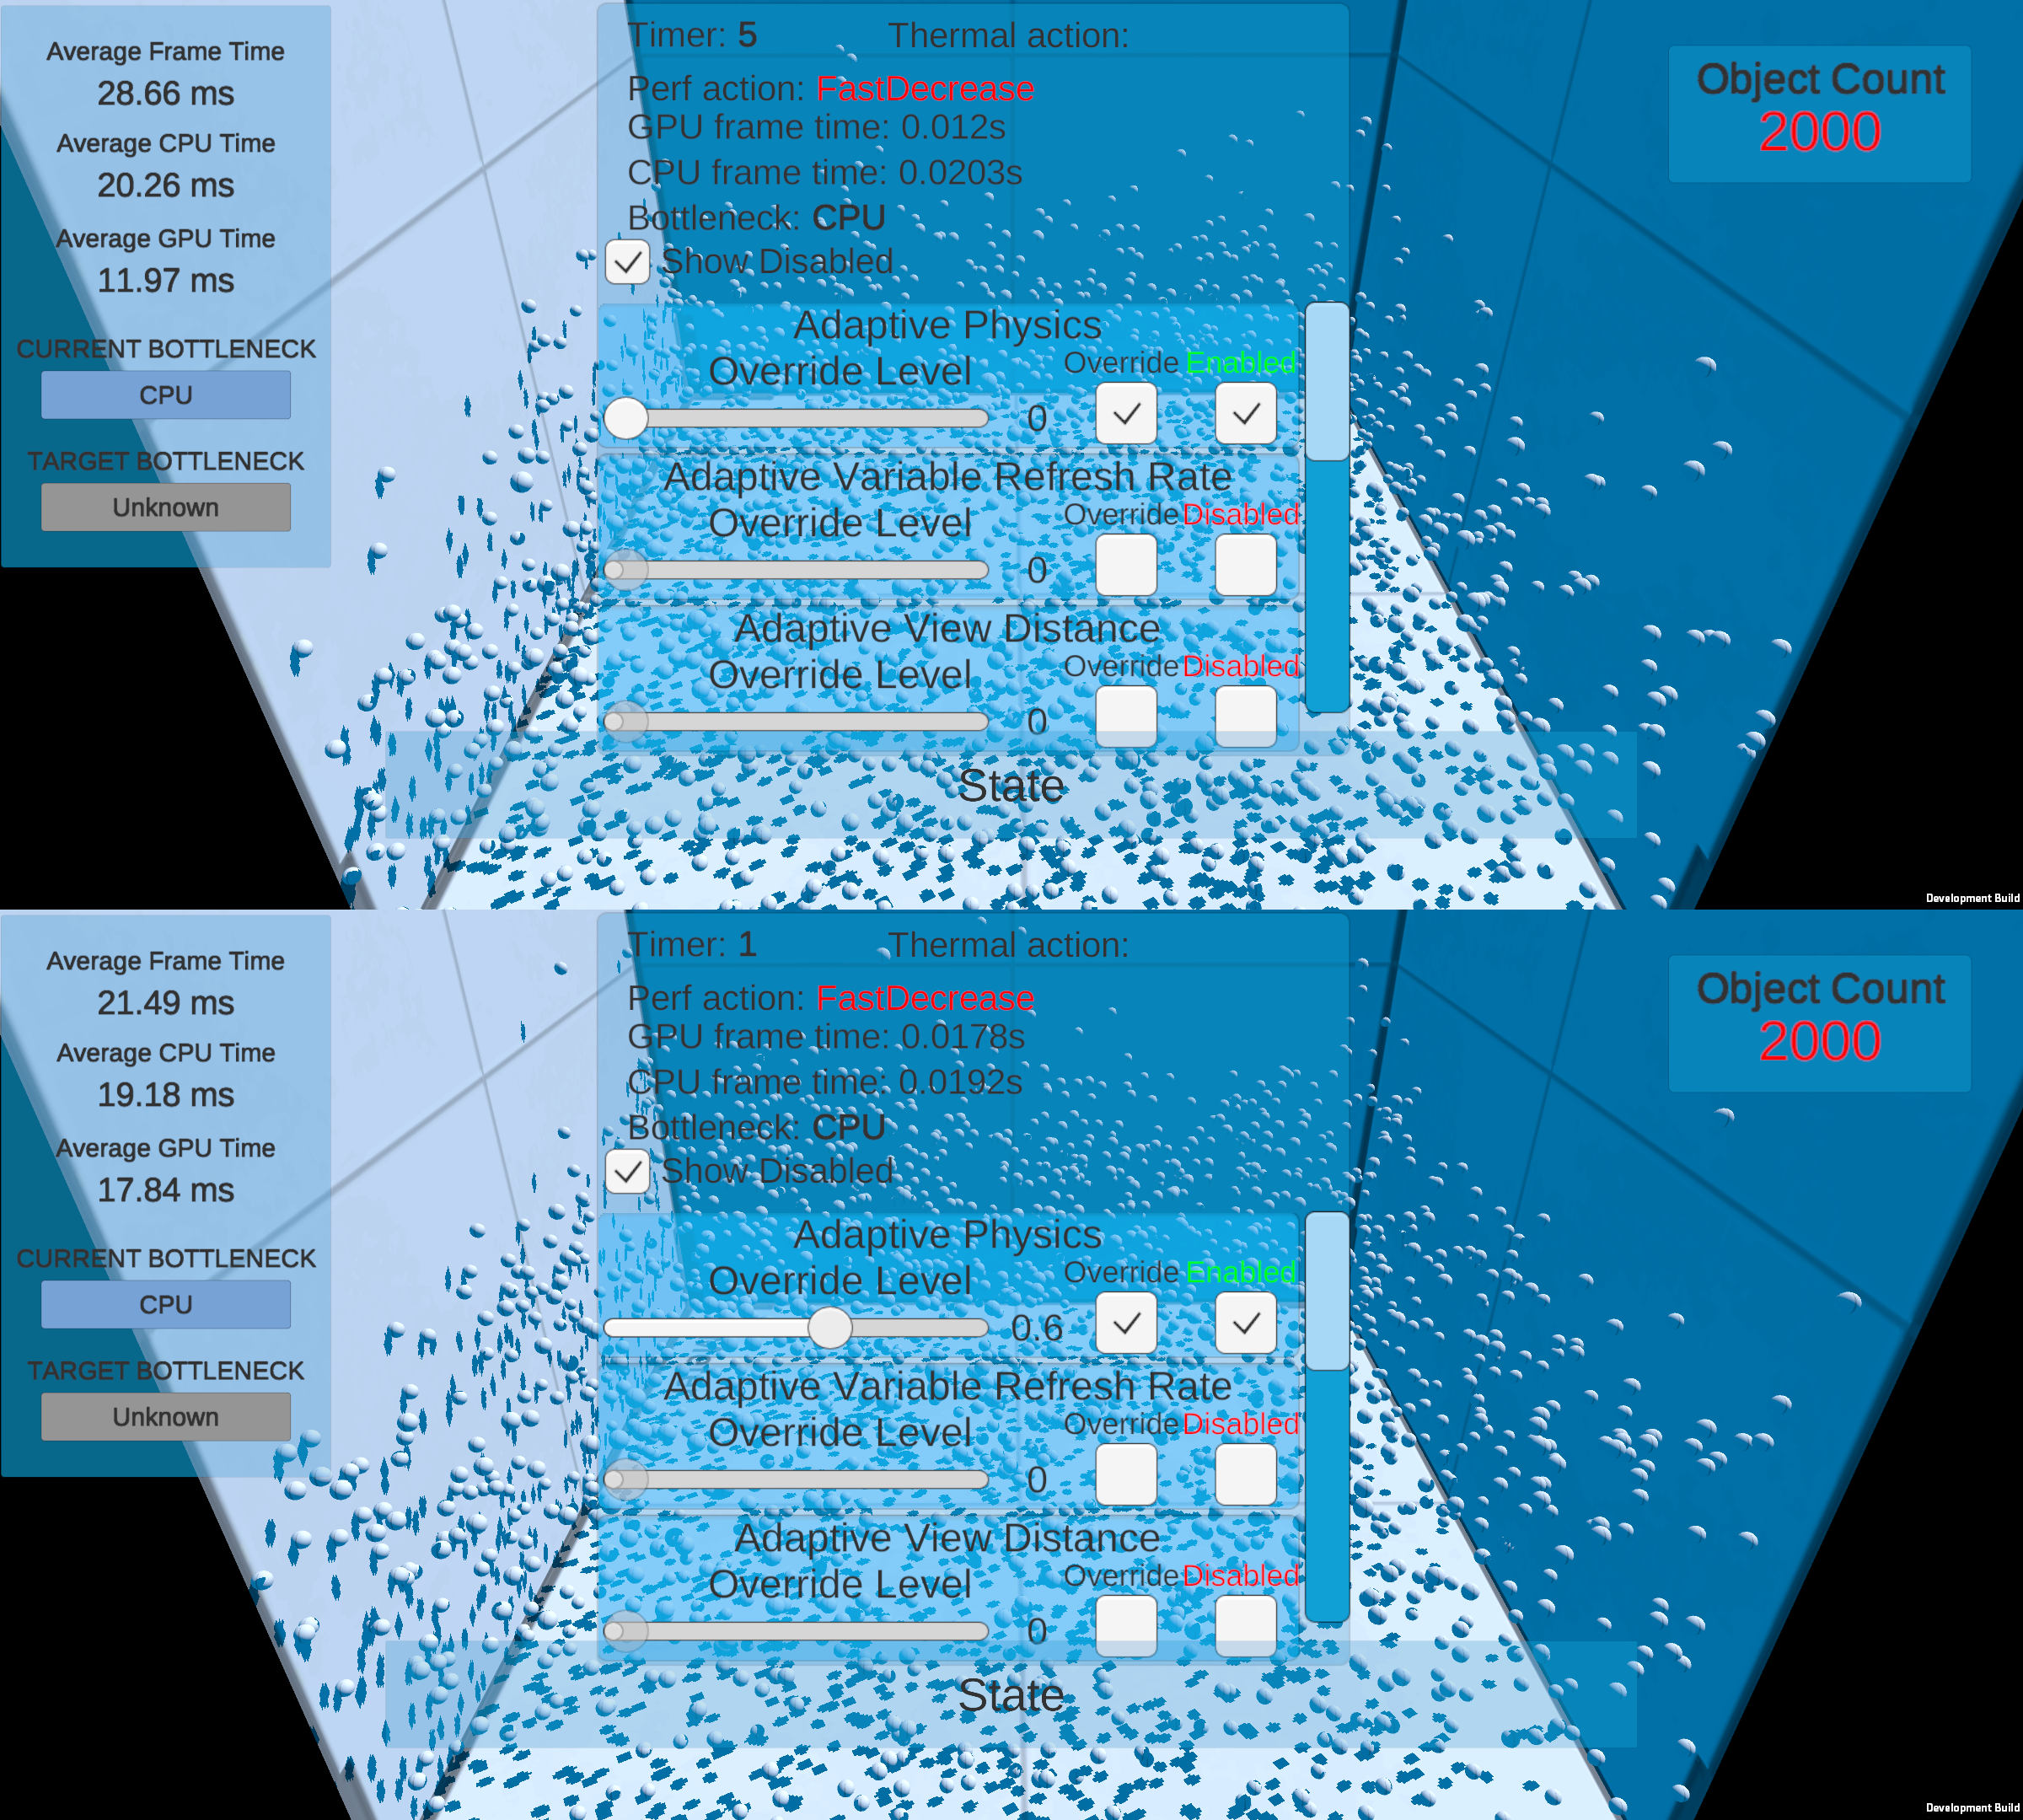
This feature uses the Indexer system to make decisions on when to change the Time.fixedDeltaTime to maintain performance and thermal stability.
A comparison between an original Time.fixedDeltaTime value and a scaled-down version. The average frame time for the original was 28ms and the average frame time for the scaled-down version was 21ms.
Visual Scripting

You can use Adaptive Performance with Unity's Visual Scripting system. When installing Adaptive Performance, it also includes nodes that you can use to access Adaptive Performance metrics.
When you install the Visual Scripting package, Unity automatically activates the Adaptive Performance units. When you add Adaptive Performance to a project with existing Visual Scripting graphs, you must recompile the units. To do this, select Edit > Project Settings > Visual Scripting > Node Library > Regenerate Units. More information about the Visual Scripting integration please visit the Visual Scripting guide
The Visual Scripting sample includes examples that cover the following metrics:
| Metric | Unit | Description |
|---|---|---|
| Thermal information | On Thermal Metric and Thermal Metric | The sample uses the On Thermal Metric event to change the color of a panel depending on the warning level. The possible colors are: • Blue: No Warning. • Orange: Throttling Imminent. • Red: Throttling. The example also uses the Thermal Metric unit to print the warning level to the console using the boolean outputs. |
| Temperature level | Thermal Metric | The sample uses the Thermal Metric unit to display the temperature level as text every frame. |
| Temperature trend | Thermal Metric | The sample uses the Thermal Metric unit to display the temperature trend as text every frame. |
| Bottleneck | Bottleneck | The sample uses the Bottleneck event to indicate the cause of a bottleneck. To do this, it changes text and the color of a panel. The possible bottleneck causes are: • Red: CPU. • Orange: GPU. • Green: Target Framerate • Gray Unknown. |
| CPU/GPU boost | Get Boost, Set Boost, and On CPU/GPU Boosted | The sample uses the Get Boost unit to display the boost mode status as text every frame. The sample uses the Set Boost unit to enable and disable boost mode for the CPU and GPU. The sample uses the On CPU/GPU Boosted event unit to change the color of buttons depending on the boost mode. The colors are: • Green: Boost mode is active. • Blue: Boost mode is not active. |
| Cluster information | Get Cluster Info | The sample uses the Get Cluster Info unit to display information about CPU cores as text. |
| Frame times | Frametiming | The sample uses the Frametiming unit to display CPU and GPU frame times as text. |
| CPU/GPU performance | Get Performance Levels and Set Performance Levels | The sample uses the Get Performance Levels unit to display the CPU and GPU levels as text. The sample's CPU Level and GPU Level buttons calculate a random number between 0 and 6 and use the Set Performance Levels unit to set the performance level to the random value. The sample uses the On Performance Level event unit to display the CPU and GPU level to the console. |
| Indexer | Get Indexer Data | The sample uses the Get Indexer Data unit to display the performance and thermal actions as text. |
| Scaler | On Level Scaler | The sample uses the On Level Scaler event unit to update the text with what scaler to update and what level to update the scalar to. |
| Frames per second | FPS | The sample uses the FPS unit to display the current frames per second. To do this it changes text and the color of a panel. The possible colors are: • Red: For a framerate less than 30. • Orange: For a framerate above 30 and less than 45. • Green: For a framerate above 45 every frame. |
For quick tests, use the Device Simulator to know what each state appears on the device.
Adaptive Decals sample
The Adaptive Decals sample shows how to dynamically adjust the draw distance of decals at runtime.

This feature uses the Indexer system to make decisions on when and how much to increase or decrease the decal draw distance to maintain performance and thermal stability.
The sample uses similar content to the Auto Performance Control sample. It loops in medium CPU load until it reaches critical framerates and then decreases the draw distance of decals. The result of this is that the render distance for decals changes depending on the CPU and GPU load.
Adaptive Layer Culling
The Adaptive Layer Culling sample shows how to dynamically adjust layer cull distances at runtime. This feature uses the Indexer system to make decisions on when and how much to increase or decrease the layer cull distances to maintain performance and thermal stability.
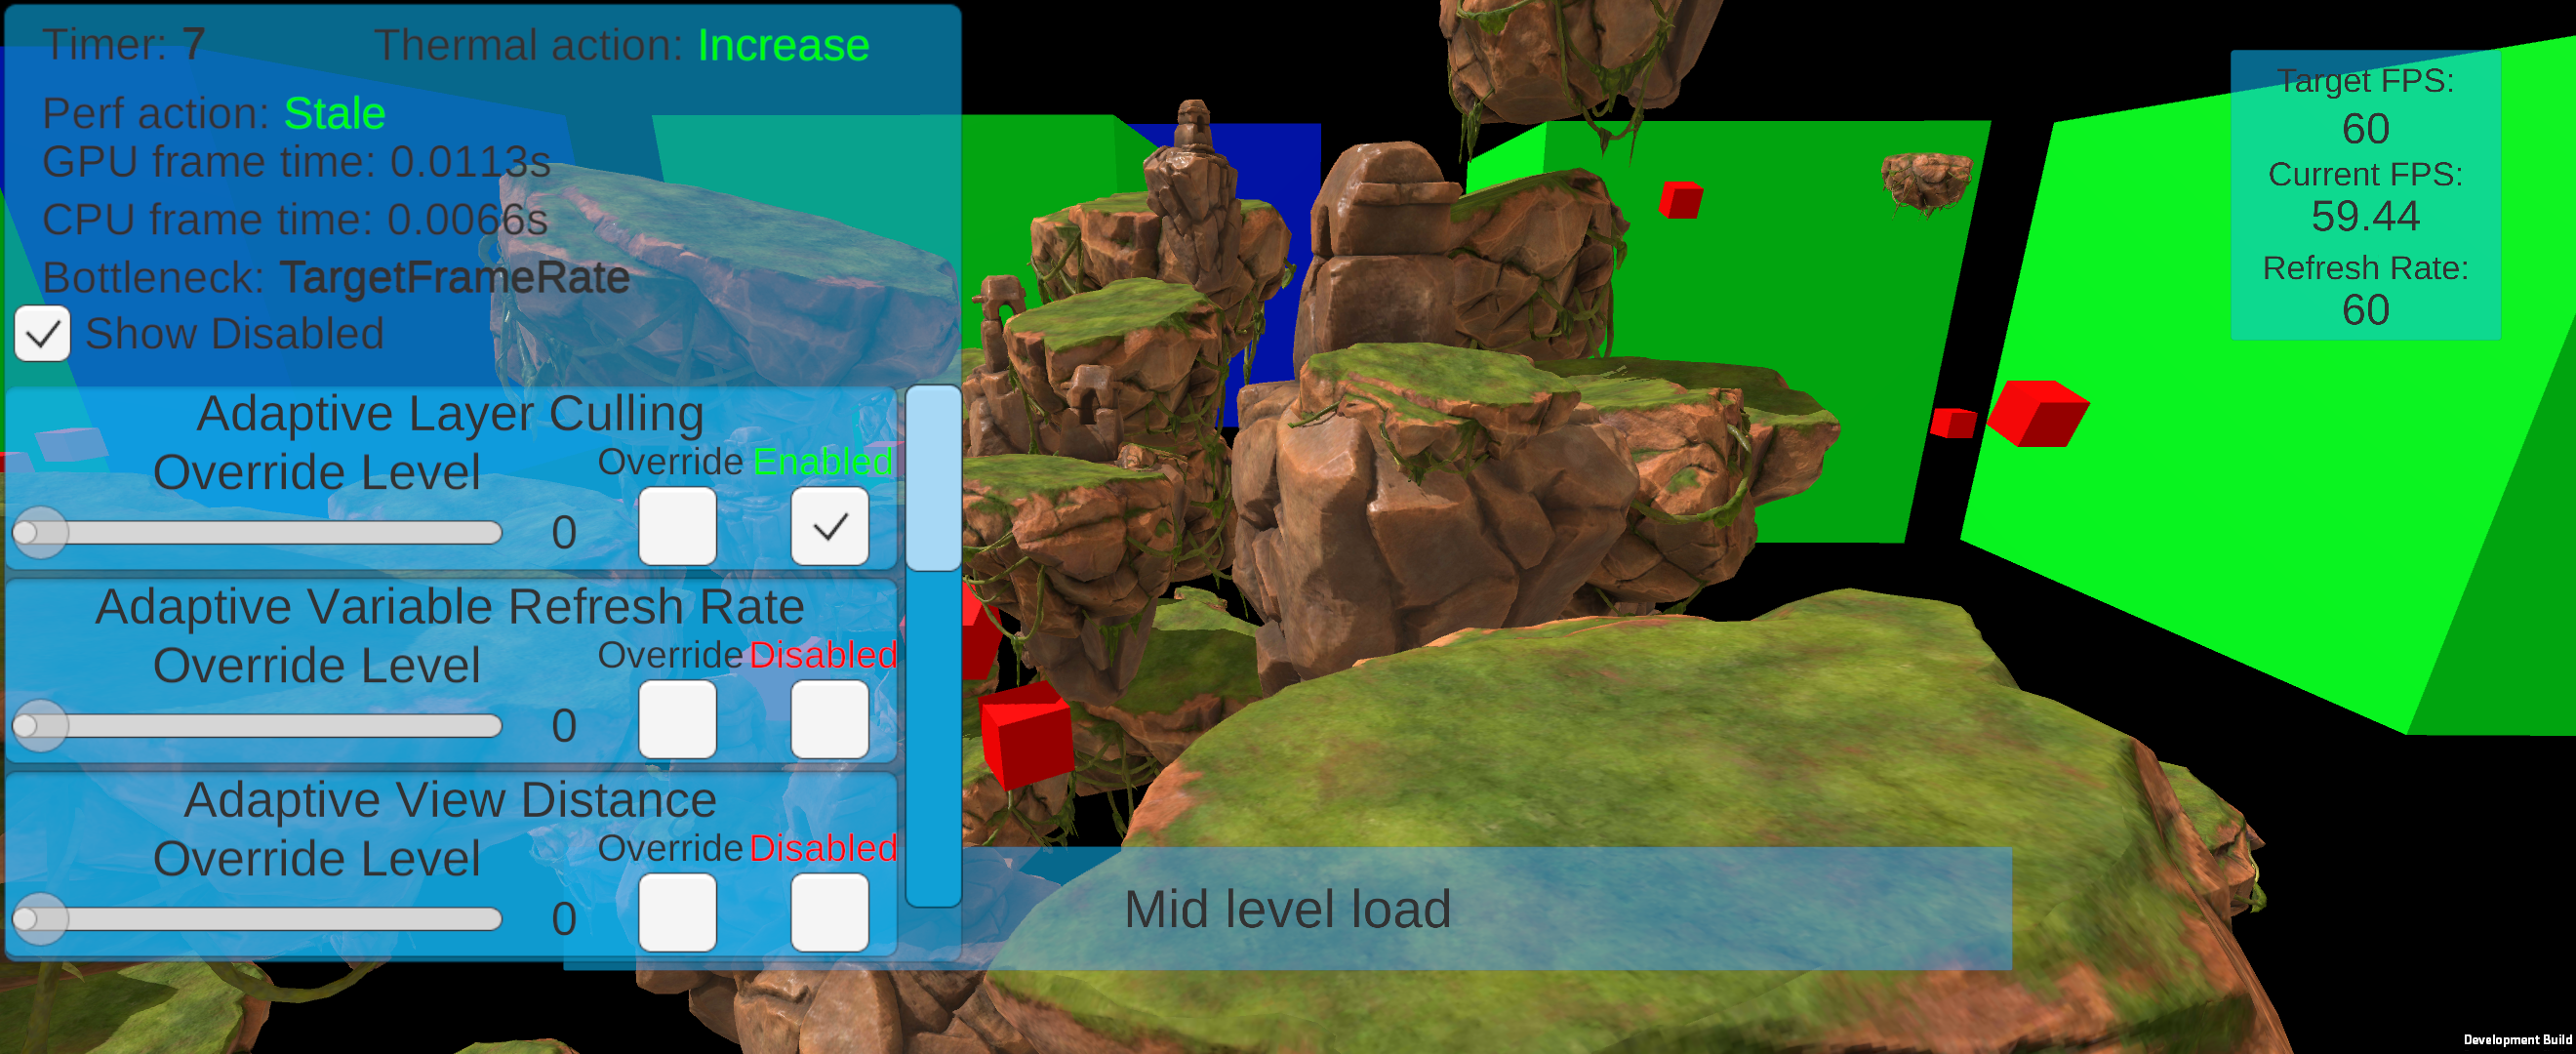
The Adaptive Layer Culling sample uses the same content as the Auto Performance Control sample. It loops in medium CPU load until it reaches critical framerates and then decreases the cull distance of the layers. The cull distance for layer changes depending on the CPU and GPU load. You can set a different value for the culling distance of each layer because they scale proportionally, which means, you can control which objects to cull sooner to save performance.
For example, the following code sample, where the default camera far clipping plane value is 1000.
        Camera camera = GetComponent<Camera>();
        float[] distances = new float[32];
        distances[0] = 0; // Default Layer - 0 will be ignored and left unscaled which results in the far clipping plane
        distances[1] = 200; // TransparentFX layer
        distances[2] = 400; // Ignore Raycast layer
        distances[3] = 900; // empty layer
        distances[4] = 1500; // Water layer
        // This example ignores the rest of the layers. This is equivalent to using a value of 0, which the Default layer uses.
        camera.layerCullDistances = distances;
In this sample:
- Objects in the Water layer have a cull distance of
1500. To help you to visualize this, the sample only uses blue objects in this layer. - Objects in the Ignore Raycast layer have a cull distance of
400. To help you to visualize this, the sample only uses green objects in this layer. - Objects in the Transparent FX layer have a cull distance of
200. To help you to visualize this, the sample only uses red objects in this layer.
As the scalar level changes, the culling distances change proportionally. For example, if the scalar level changes to 50%:
- The culling distance for the Water layer becomes
750. - The culling distance for the Ignore Raycast layer becomes
200. - The culling distance for the Transparent FX layer becomes
100.
In the sample, the distance change at which objects on layers are culled are based upon the CPU and GPU load. By priming the culling layers you can define how quick the scaling affects the different layers.
Lifecycle Management
The Lifecycle Management sample shows how to control the lifecycle of Adaptive Performance at runtime, such as to create(initialize) and destroy (de-initialize) Adaptive Performance, start and stop Adaptive Performance, and inspect various state properties. You can also register an event to get notifications when Adaptive Performance is created (initialized) or destroyed (de-initialized).

Performance Mode
The Performance Mode sample shows the process to register and respond to performance mode change events from the Adaptive Performance API. To test this, you can use the Android Game Dashboard UI or Android Debug Bridge (ADB).
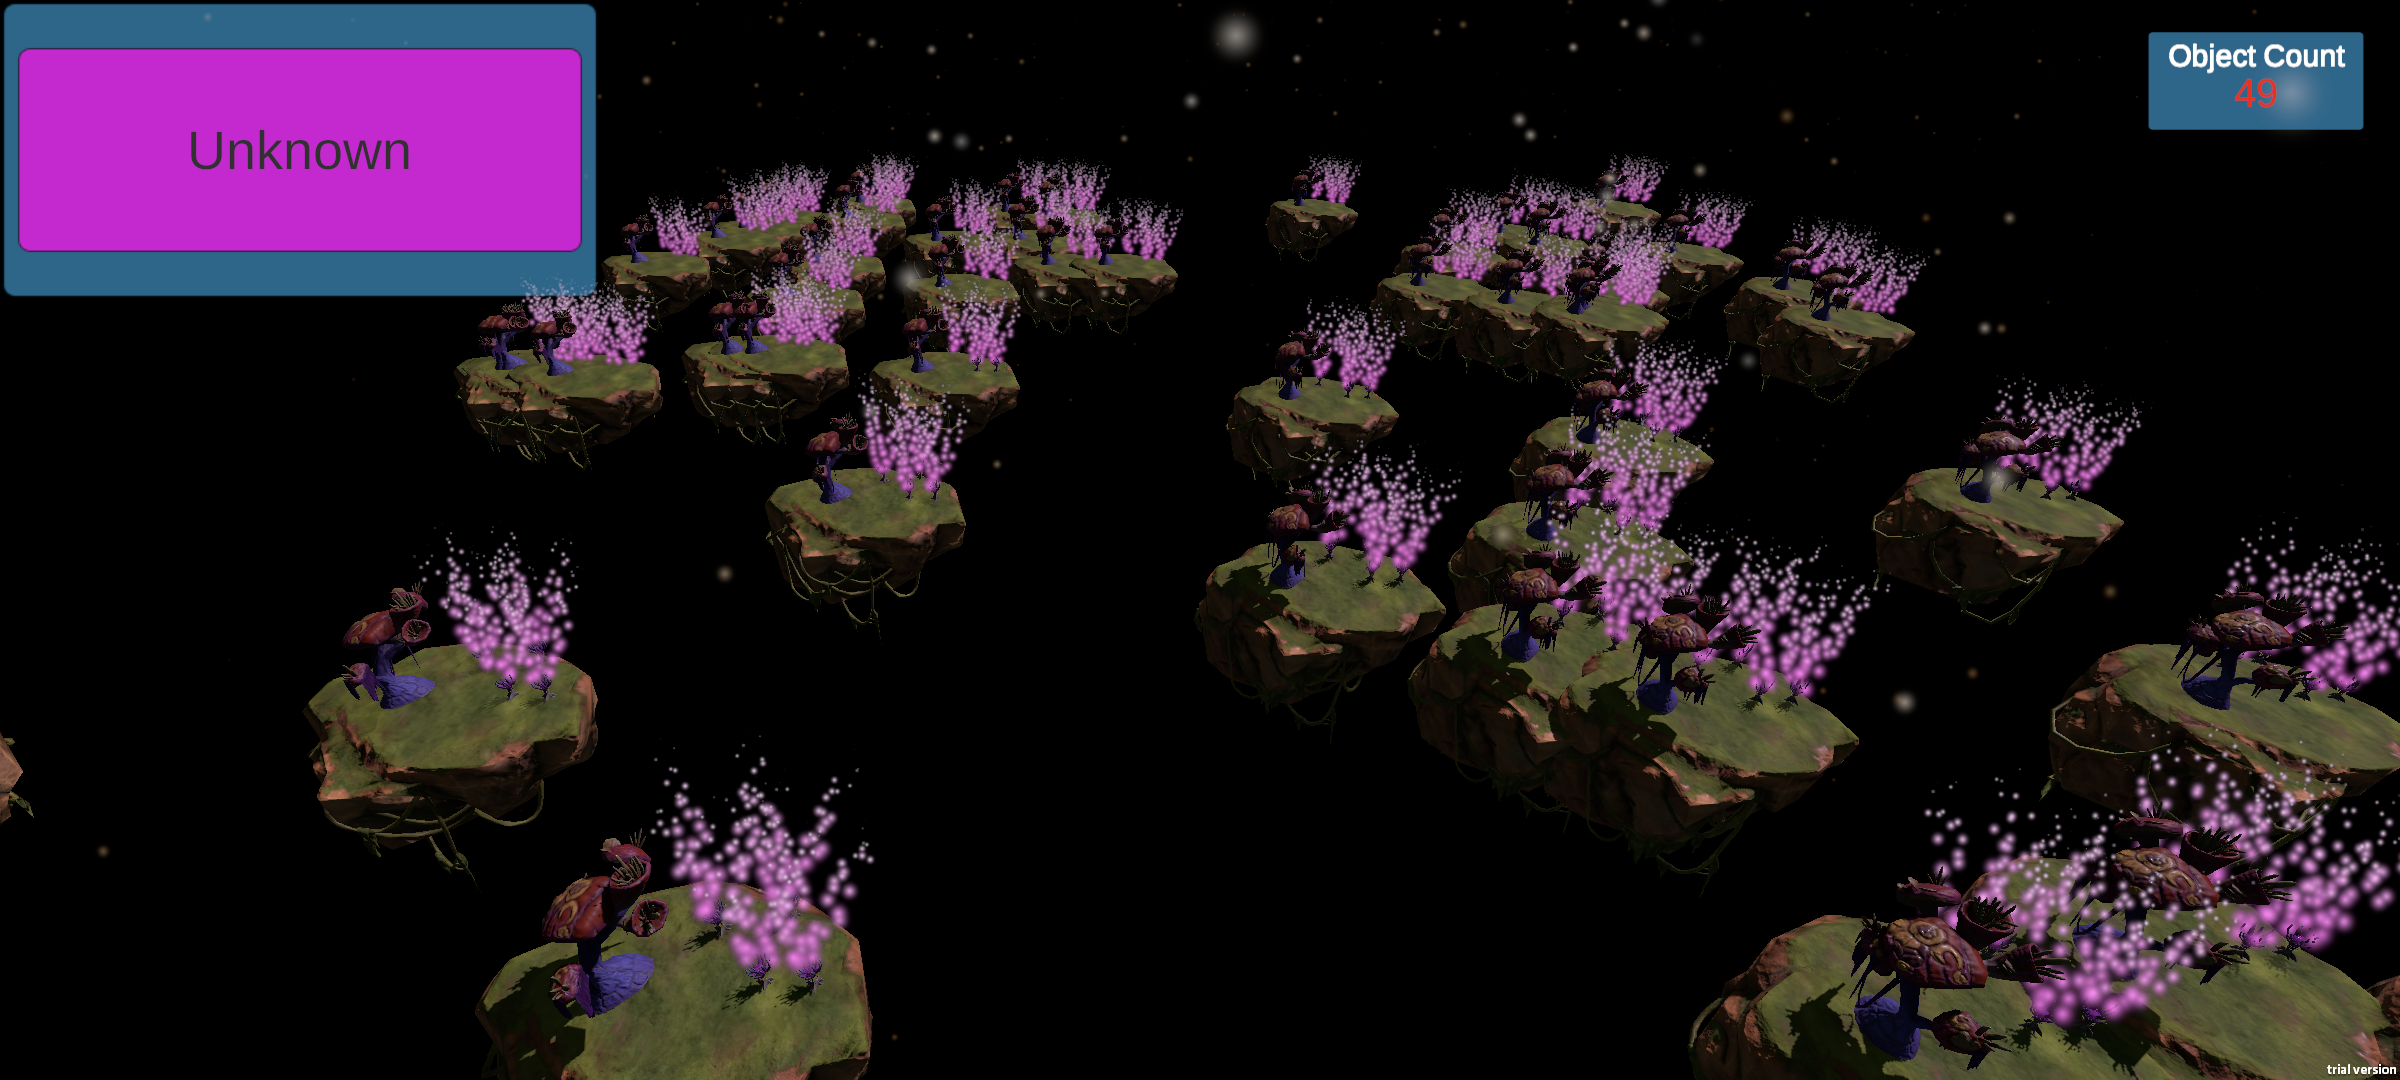
This sample is based on the Thermal sample and because it's heavy on GPU usage to show how to modify the app at runtime based on the user selected performance mode, you can choose from the following performance modes:
- Standard - Default performance mode.
- CPU - Performance mode accelerates CPU.
- GPU - Performance mode accelerates GPU.
- Optimize - Performance is optimized as this mode might accelerate both CPU and GPU.
- Battery - Performance is limited as this mode is set to preserve battery.
- Unknown - Performance mode is unknown.
Note This demo requires you to install the Android provider.
Technical details
Most samples are designed for Unity built-in render pipeline. Some samples require other Render Pipelines to showcase the features. For more information, refer to the Universal Render Pipeline section below.
Project Settings
To enable proper timing for Adaptive Performance, you need to enable the Frame Timing Stats option (menu: Edit > Project Settings > Player > Other Settings).
If you want to use Application.targetFrameRate to limit the target framerate, set the VSync Count option (menu: Edit > Project Settings > Quality > Other to Don't Sync).

Unity has several quality levels in the quality settings. For example, it's recommended to switch the VSync Count to Don't Sync for each quality level to avoid issues with Adaptive Performance features like Adaptive framerate and limiting the target framerate with Application.targetFrameRate.
Optimized frame pacing
Adaptive Performance and Variable Refresh Rate aren't compatible with frame pacing. Therefore, it's recommended to disable Optimized Frame Pacing under Edit > Project Settings > Player > Resolution and Presentation.
Universal Render Pipeline
You must install Universal Render Pipeline to use the following samples in your project:
- Adaptive Batching Sample
- Adaptive LUT Sample
- Adaptive MSAA Sample
- Adaptive Shadow Sample
- Adaptive Sorting Sample
- Adaptive Transparency Sample
The Scalers used in those samples directly change settings in the Universal Render Pipeline and therefore don't have any effect when use them with any other Render Pipeline.
Adaptive Performance requires Universal Render Pipeline versions 12.0 and later. Install it via the Unity Package Manager.
To use the Universal Render Pipeline Settings that Unity ships with the samples, follow these steps:
- Go to Project Settings > Graphics > Scriptable Render Pipeline Settings and add the Universal Render Pipeline Asset from
Environment/URP Settings/APSamplesHighQuality.asset. - Go to Project Settings > Quality > Rendering and add the Universal Render Pipeline Asset from
Environment/URP Settings/APSamplesHighQuality.asset. - Convert the Assets from Unity built-in pipeline to Universal Render Pipeline. Go to Edit > Render Pipeline > Universal Render Pipeline > Upgrade Project Materials to UniversalRP Materials from Unity's main menu.