UI Toolkit profiler module reference
The UI Toolkit profiler module collects data about the time your application spends rendering and updating your UI.
Use the module to identify performance bottlenecks and optimize your UI elements.
You can profile UI for Edit mode, Play mode, and player builds on devices. The profiler’s Play mode captures only in-game UI, while Edit mode captures Unity Editor UI and in-game UI running in the Game view. For more information on profiling, refer to Collecting performance data.
To open the Profiler window, go to Window > Analysis > Profiler. For more information, refer to Unity Profiler.
UI Toolkit profiler module charts
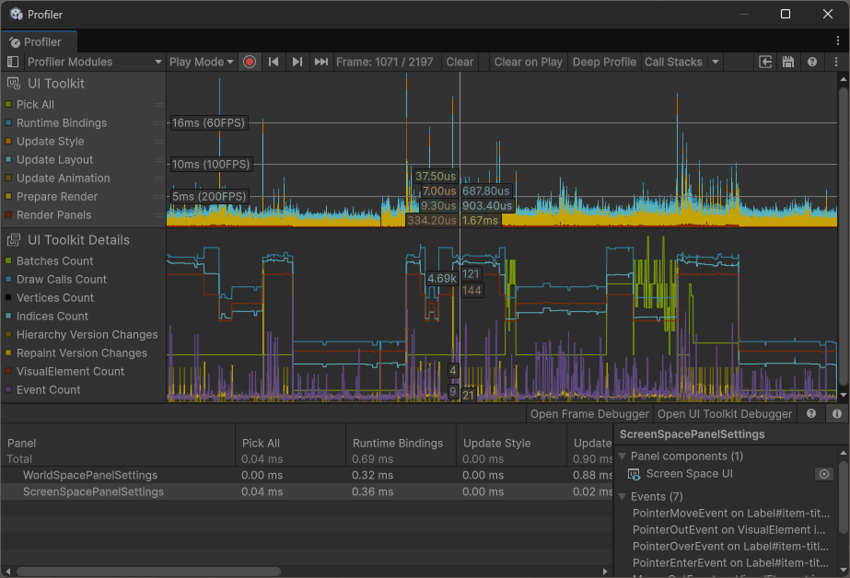
The UI Toolkit profiler module contains the following charts. Each chart plots the time that one phase of the UI update loop takes in a frame:
| Chart | Description |
|---|---|
| Pick All | Time spent identifying which element is under the pointer or hovered. |
| Runtime Bindings | Time spent updating bindings. |
| Update Style | Time spent updating styles. |
| Update Layout | Time spent updating layouts. |
| Update Animation | Time spent updating animations. |
| Prepare Render | Time spent preparing graphics data for rendering your UI. |
| Render Panels | Time spent rendering your UI. |
Select this module in the Profiler window to view the data. Select a point on the chart to view the data for that frame in the details pane in the bottom half of the window.
For each panel, the details pane displays the chart data along with the following:
| Data | Description |
|---|---|
| Panel | The panel name. For runtime UI, the panel name is the Panel Settings asset name. For Editor UI, the panel name is the EditorWindow name. |
| Events | Number of events dispatched on this panel. For example, pointer, keyboard, or navigation. |
| Total | Time spent across the UI Toolkit charts. |
| Hierarchy Changes | Number of hierarchy version changes. For example, adding, removing, or reparenting of visual elements. |
| Repaint Changes | Number of repaint version changes. |
| VE Count | Number of visual elements in this panel’s hierarchy. |
A version change is any modification that flags data for a panel to reprocess. Panels process these changes in a deferred pass, which can itself produce more version changes.
For example, the Repaint Version Changes value is the number of changes accumulated since the panel last updated its rendering data. Updating rendering data isn’t the same as rendering a frame: a panel can render multiple frames without updating its data, or update its data multiple times between renders.
Because the deferred pass can itself produce version changes, a single user action can register as several.
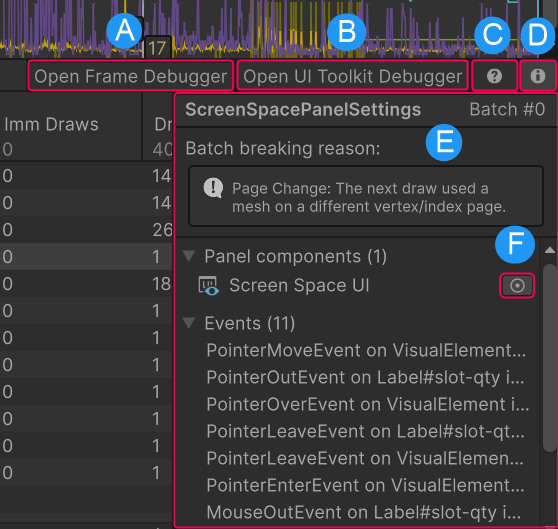
The UI Toolkit profiler modules display the following additional controls:
- A: Select Open Frame Debugger to inspect underlying rendering calls. For more information, refer to Frame Debugger.
- B: Select Open UI Toolkit Debugger to inspect a panel’s UI elements. For more information, refer to UI Toolkit Debugger.
- C: Open the documentation related to profiling UI.
- D: Select the Inspector icon to show or hide UI Toolkit related data.
- E: This pane is available when you show UI Toolkit related data by selecting the Inspector icon highlighted in (D). It displays more data for the chosen row, such as the associated panel components, batch breaking reasons, and the dispatched events. The events list provides information about the event type, the receiving element’s type and name, the panel component, and the event parameters.
- F: Select this to highlight the panel component in the Scene view and the Hierarchy.