IL2CPP managed stack traces
When an exception happens in managed code, the stack trace for the exception can help you understand the cause of the exception. However, the managed stack trace might not appear as expected in some cases. The stack trace varies depending on the build configuration.
C++ compiler configuration
You can set the C++ compiler configuration for IL2CPP builds in one of the following ways:
-
Through the Player Settings menu in the Editor. Perform the following steps to change the scripting back end through the Player Settings menu:
From code, by calling
PlayerSettings.SetIl2CppCompilerConfigurationwith a value from theIl2CppCompilerConfigurationenum.
The settings have the following implications for managed stack traces:
- Debug: IL2CPP reports a reliable managed stack trace, and includes each managed method in the call stack. The stack trace doesn’t include line numbers from the original C# source code.
- Release or Master: IL2CPP might produce a call stack that’s missing one or more managed methods. This happens when the C++ compiler inlines the missing methods. Method inlining usually improves runtime performance, but it can make call stacks more difficult to understand.
IL2CPP always provides at least one managed method on the call stack. For stack traces created from managed exceptions, this is the method where the exception occurred. It also includes other methods if they aren’t inlined.
IL2CPP stack trace information
You can configure IL2CPP to include file and line number information in managed stack traces in one of the following ways:
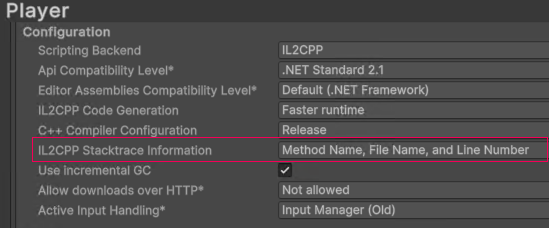
- Through Player settings in the Editor: Edit > Project Settings > Player > Other Settings. Then, under the Configuration heading, set the IL2CPP Stacktrace Information property to the Method Name, File Name, and Line Number setting.
- From code, by calling
PlayerSettings.Il2CppStacktraceInformationwithIl2CppStacktraceInformation.MethodFileLineNumberas the parameter value.
This setting instructs IL2CPP to include all managed stack frames in the call stack. Each stack frame also includes the proper C# line number, as long as a managed symbol file (.pdb) is available for the managed assembly (.dll) where that code exists.
When you enable this feature, it slightly increases both the build time and final size of the built program. The Player build process includes an additional step that processes debug symbol files and generates a new data file that includes the necessary symbol formation. Unity ships this data file with the built Player and uses it at runtime to determine C# line information in call stacks.
When you enable this feature, Unity generates correct call stacks in either the Release or Master configurations, even with method inlining active.
Script debugging
To enable Script Debugging, go to File > Build Profiles and then enable the Script Debugging checkbox. When script debugging is enabled, IL2CPP reports the correct managed stack trace with the method, file, and line number. This comes at the expense of a larger program size and decreased performance.
Tip: If you only want to improve stack traces, don’t enable script debugging. Instead, enable source code line numbers as described above.