Optimizing performance
Table of Contents
- Update mechanisms
- Batching elements
- Vertex buffers
- Uber shader and eight-texture limit
- Dynamic texture atlases
- Masking
- Animations and transitions
- Runtime data binding
- Show and hide elements
- Overdraw
- Memory management
- Profiling tools
- Unity 6 performance enhancements
Building a sophisticated game UI often means managing a large hierarchy of onscreen elements. With hundreds of elements in play, this can cause technical challenges. Even subtle inefficiencies can build up into stutters or hitches at runtime – and those can negatively impact the player experience.
The good news is that most of these challenges can be addressed through some optimization. While Unity 6 brings significant UI Toolkit improvements for better out-of-the-box performance, a truly efficient user interface still takes some effort on the part of the developer.
Much of this work often comes down to eliminating unnecessary overhead and reducing draw calls. Let’s explore some tips for optimizing UI Toolkit in Unity 6 to help you get the most out of it.
Update mechanisms
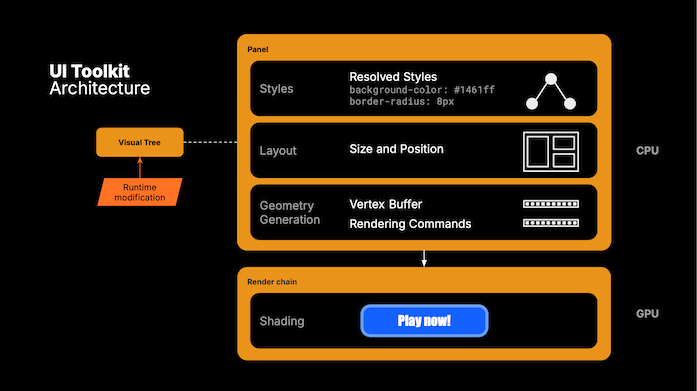
The visual treeAn object graph, made of lightweight nodes, that holds all the elements in a window or panel. It defines every UI you build with the UI Toolkit.
See in Glossary contains several update mechanisms that respond to changes in styles, layout, or content at runtime. Any one of these update mechanisms can affect performance. The following table provides a summary of when they occur, and each one’s impact on performance.
| Update mechanism | Description | When it happens | Performance impact |
|---|---|---|---|
| Style resolution | Determines the final appearance of elements by applying USS selectors and styles | Triggered when classes or styles are changed, such as adding a style class or modifying a color | Large or deeply nested hierarchies make this process expensive. Minimize frequent changes. |
| Layout recalculation | Adjusts the size and position of elements to fit correctly within the UI hierarchy | Triggered by changes to element size, position, or alignment, e.g., resizing a panel or moving elements | Frequent layout updates can be costly. Use transforms for animations instead of altering positions directly. |
| Vertex buffer updates | Updates geometric shapes used to render UI elements, like rectangles or rounded corners | Triggered when an element’s geometry changes, such as adding rounded corners or modifying borders | Updating vertex buffers is resource-intensive. Avoid frequent geometry changes. |
| Rendering state changes | Changes rendering states like textures and blending modes required to draw elements | Triggered by features like masking or unique textures, that disrupt batching | Excessive state changes increase CPU overhead. Optimize by batching and limiting unique textures or masks. |
The cost of these operations, of course, depends on how often and how extensively you modify UI elements.
Batching elements
When rendering a user interface, every visual elementA node of a visual tree that instantiates or derives from the C# VisualElement class. You can style the look, define the behaviour, and display it on screen as part of the UI. More info
See in Glossary requires instructions to be sent to the GPU. UI Toolkit optimizes these draw calls through batching. This groups visual elements with identical GPU requirements together so they can be processed together. Batching significantly reduces the communication overhead with the GPU, much like draw call batching with GameObjectsThe fundamental object in Unity scenes, which can represent characters, props, scenery, cameras, waypoints, and more. A GameObject’s functionality is defined by the Components attached to it. More info
See in Glossary.
To batch elements efficiently they must share the same GPU state – the same shadersA program that runs on the GPU. More info
See in Glossary, textures, meshThe main graphics primitive of Unity. Meshes make up a large part of your 3D worlds. Unity supports triangulated or Quadrangulated polygon meshes. Nurbs, Nurms, Subdiv surfaces must be converted to polygons. More info
See in Glossary data, and other GPU-specific parameters. For example, a sequence of text elements using the same font and style can be batched together. However, inserting an image between them requires different GPU settings. That forces a new batch.
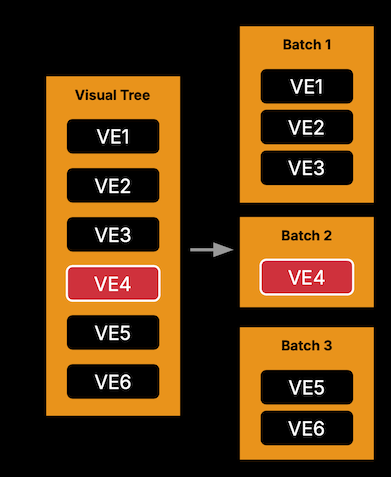
Every batch “break” like this introduces a small inefficiency. To maintain high performance, it’s essential to structure your UI to minimize these breaks.
Since every batch may issue one or more draw calls to the GPU, fewer batches generally mean reduced overhead and better performance.
In the next sections, let’s explore techniques to optimize your UI’s batch count and achieve consistent performance.
Vertex buffers
In UI Toolkit, vertex buffers store the geometry (vertices) needed to render your UI. When a UIDocument creates a Panel at runtime, it pre-allocates a single vertex buffer to handle the visual elements. Think of this buffer as a “heap allocator” for visual elements, dynamically allocating memory as elements are added to the UI.
If the UI exceeds the capacity of the vertex buffer, additional buffers are created. This can fragment batching, increase the number of draw calls, and ultimately reduce performance.
To address this, you can adjust the Vertex Budget in the Panel Settings to configure the initial size of the vertex buffer. The default value is 0, allowing Unity to determine the size automatically. However, for complex UIs, manually increasing this value can improve performance by reducing the number of draw calls.
Here’s an example. This UI contains a lot of elements that can’t fit within a single vertex buffer. The Frame Debugger shows that this results in two draw calls instead of one.
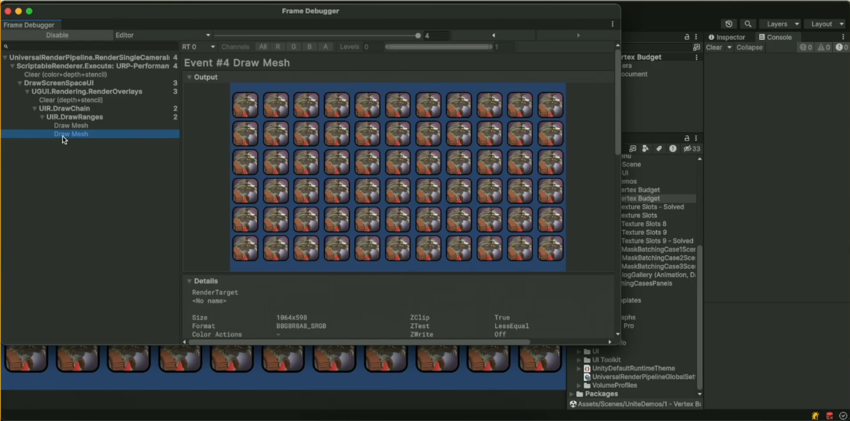
Increasing the Vertex Budget to a value to 20,000 vertices, for instance, may mean that the framebuffer can fit the UI elements into a single draw call. This makes our example UI more efficient by changing one setting.
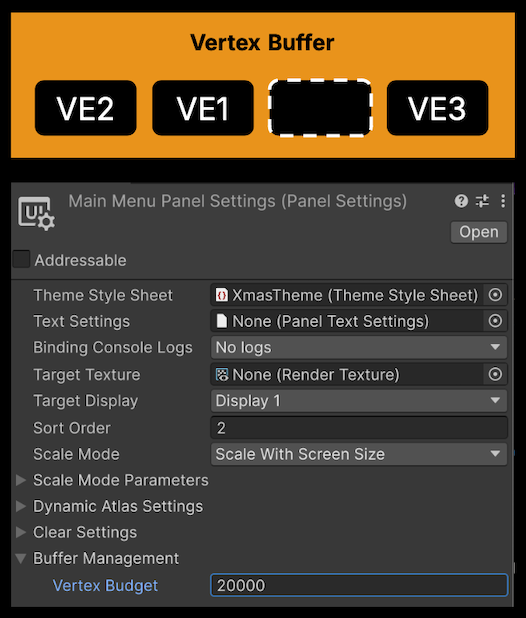

For complex UIs, manually increasing this value may improve performance by reducing draw calls, but be careful of over-allocating memory. Use the Frame Debugger and Unity Profiler to find the best balance between memory usage and number of draw calls.
Uber shader and eight-texture limit
UI Toolkit consolidates all UI rendering functionality into a single versatile “uber shader.” Rather than rely on multiple shader variants, this shader uses dynamic branching to select the appropriate rendering pathThe technique that a render pipeline uses to render graphics. Choosing a different rendering path affects how lighting and shading are calculated. Some rendering paths are more suited to different platforms and hardware than others. More info
See in Glossary at runtime. This reduces CPU overhead by minimizing shader switches but does add some GPU cost due to the branching logic.
One feature that makes this shader powerful is its support for up to eight textures within the same batch. This allows elements with different textures to render in the same draw call. In the image below you can see a UI consisting of eight different textures:
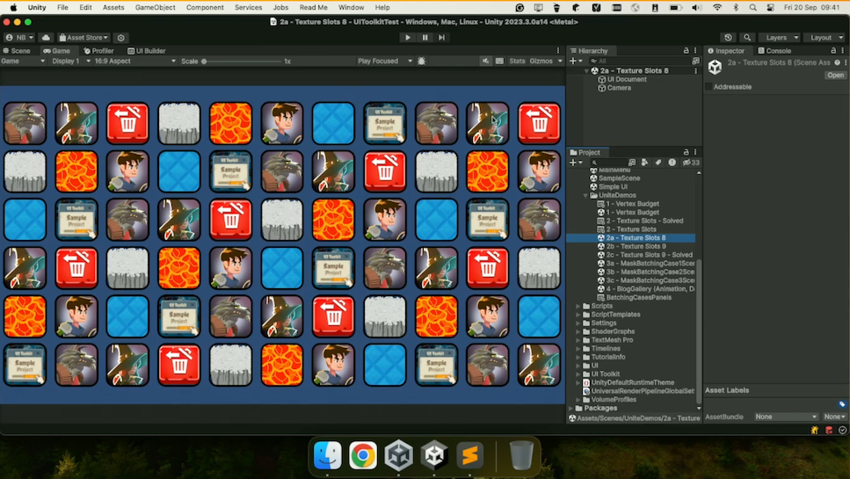
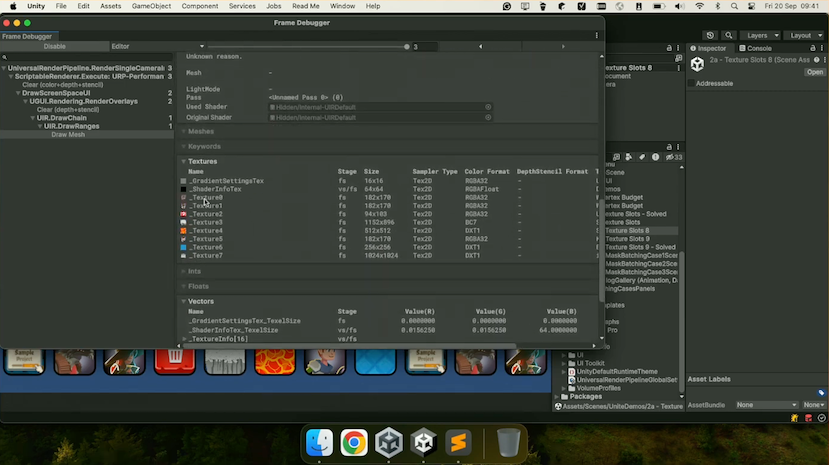
As shown in the Frame Debugger, Unity renders an example UI using one draw call for up to eight textures. However, exceeding the eight-texture limit forces the batching system to split into separate batches, increasing overhead.
Here’s what happens if you exceed the eight-texture limit. The one draw call is now many more:

To mitigate this limitation, UI Toolkit provides tools to optimize texture usage. For example, consolidating textures into atlases helps keep the number of textures within the supported limit, preserving batch efficiency and reducing draw calls.
Dynamic texture atlases
Switching between multiple textures can force UI Toolkit to break batches, increasing draw calls and reducing performance. A common solution to this problem is texture atlasing, which combines smaller textures into a single larger texture.
If you’re familiar with the 2D SpriteA 2D graphic objects. If you are used to working in 3D, Sprites are essentially just standard textures but there are special techniques for combining and managing sprite textures for efficiency and convenience during development. More info
See in Glossary Atlas, you already know an effective way to improve performance. By packing multiple sprites into a sprite atlasGraphics: A utility that packs several sprite textures tightly together within a single texture known as an atlas. More info. 2D: A texture that is composed of several smaller textures. Also referred to as a texture atlas, image sprite, sprite sheet or packed texture. More info.
See in Glossary, Unity treats them as a single texture, reducing batch breaks and draw calls. The 2D Sprite Atlas integrates seamlessly with UI Toolkit, making it a great choice for static or pre-defined content.
However, the 2D Sprite Atlas has limitations, such as the inability to handle runtime-generated textures. It also requires some setup and sprite layout ahead of time, which can be time-consuming.

UI Toolkit’s dynamic texture atlas effectively merges multiple images into one texture, reducing texture state changes. You can configure atlas settings in Panel Settings and visualize the atlas layout in the Dynamic Atlas Viewer (available in the UI Toolkit Debugger window).
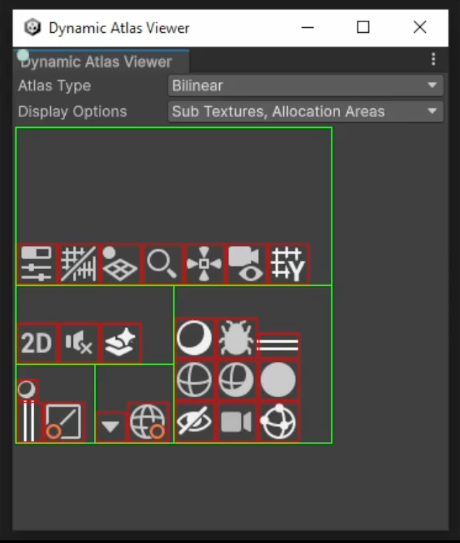
Note that if your UI undergoes extensive changes (such as adding and removing many textures over time), the atlas may become fragmented. In such cases, the ResetDynamicAtlas API can restore the atlas to its initial state.
Remember that you can use the 2D Sprite Atlas and dynamic texture atlases side-by-side within UI Toolkit. Sprite Atlases are ideal for static, predefined content, while dynamic atlases excel in situations where runtime changes are common.
Masking
UI Toolkit uses the stencil bufferA memory store that holds an 8-bit per-pixel value. In Unity, you can use a stencil buffer to flag pixels, and then only render to pixels that pass the stencil operation. More info
See in Glossary to create masks – areas that show or hide parts of UI elements. Since the stencil buffer is part of the GPU state, changing mask settings can force UI Toolkit to break batches.
Be aware that hierarchically layering masked elements adds complexity, as each nested depth requires the stencil buffer to track additional states. That increases the GPU workload.
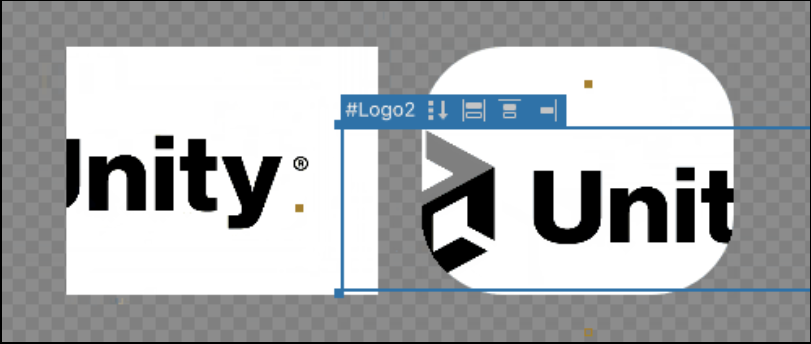
UI Toolkit supports two types of masking:
Rectangular-based masking: Rectangular masks use shader-based operations, preserving batch consistency without GPU state changes. This technique doesn’t use the stencil buffer, so you can nest rectangular masks without depth limits.
Rounded Corners and Complex Masks (stencil buffer): Rounded corners and other complex shapes require stencil buffer operations, potentially breaking batches at each masking level. This technique supports up to seven nested levels of masking.
To optimize performance for masked elements:
Use rectangular masks when possible to avoid stencil operations.
Minimize the nesting depth of masks. Keeping masks flat in the hierarchy ensures fewer stencil recalculations.
When possible, use a single mask over a parent element instead of multiple masks over child elements.
When multiple masking layers are unavoidable, apply the Mask Container usage hint to optimize stencil state setup. However, use this sparingly to prevent batch breaks.
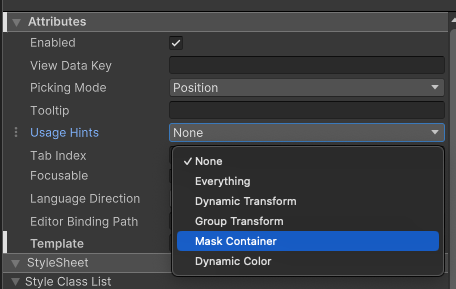
Finally, verify the impact of these optimizations using the Frame Debugger to ensure efficient rendering and batching.
Animations and transitions
While UI Toolkit’s USS transitions offer simple property animations, changing layout properties like size or position can trigger expensive layout recalculations. To optimize animations and reduce performance overhead, you can try several strategies.
First, prioritize transform-based animations over layout property changes. Instead of animating properties like width, height, top, or left, use translate, scale, or rotate transforms. These operations are processed directly on the GPU, avoiding the need for layout recalculations. That can result in smoother animations.
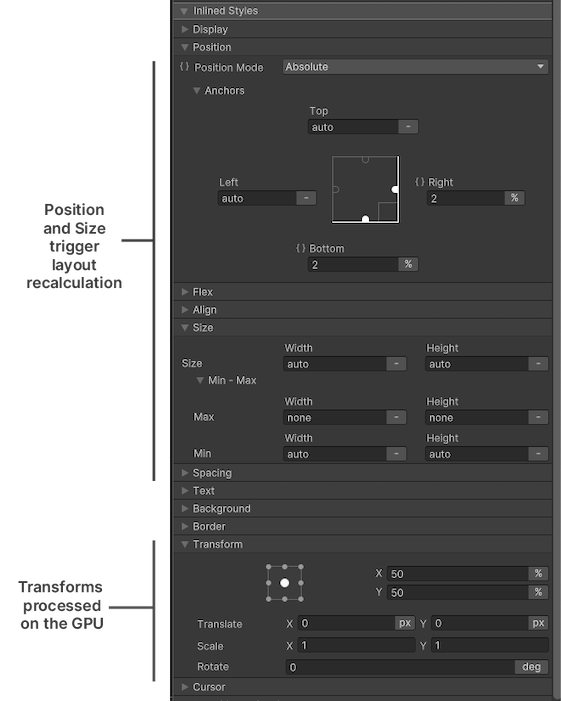
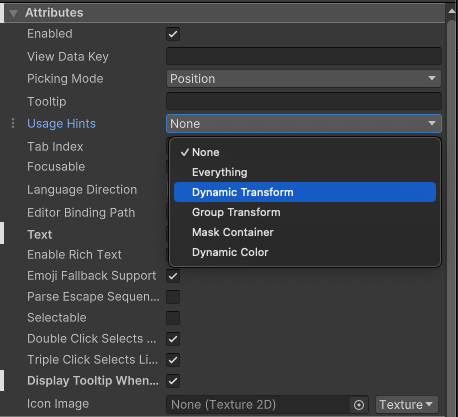
You can also enable usage hints for any visual element that needs to be animated.
The DynamicTransform hint instructs UI Toolkit to handle position and transform updates on the GPU, bypassing expensive vertex data recalculations.
For parent containers with multiple animated children, the GroupTransform hint can significantly reduce overhead. It applies a single transform to the parent, which the GPU efficiently propagates to all child elements, optimizing animations for large groups.
Also, as a general rule, avoid switching classes for style changes in large hierarchies during animations. Class changes can trigger extensive style recalculations, especially in complex UI structures. Instead, update styles directly using inline property changes to minimize computational costs.
Finally, monitor animation performance using Unity’s Frame Debugger. This tool allows you to verify that these optimizations are working as intended.
Runtime data binding
Runtime data binding in Unity simplifies updating UI elements by ensuring they automatically reflect changes in the underlying data. This eliminates the need for manual updates, making UI development more efficient and maintainable.
Some techniques can optimize this process:
Property bags and source generation
A property bag is a companion object that enables efficient traversal and manipulation of a type’s data. By default, Unity generates property bags using reflection the first time a type is accessed. While this reflective approach is convenient, it introduces a small runtime overhead because it happens lazily – only when the property bag has not been registered yet.
To improve performance, you can enable code generation for property bags. Tag the type with Unity.Properties.GeneratePropertyBag and ensure the assembly is also tagged for code generation. Unity will then generate and register the property bag at compile time, eliminating the need for reflection during runtime. For more details, refer to the Property bags documentation.
While the GeneratePropertyBag attribute optimizes an entire type, adding the CreateProperty attribute to individual properties allows Unity to generate binding code at compile time. This removes the need for runtime reflection to discover and connect properties, ensuring faster and more efficient data binding.
In many cases, using the CreateProperty alone is enough to optimize runtime data binding. However, if the type requires additional optimizations, like efficient serialization or frequent traversal of all its properties, combining CreateProperty with GeneratePropertyBag provides the best overall performance.
Change Tracking
Runtime data binding includes two interfaces that optimize how often the data bindings can update:
IDataSourceViewHashProvider: This interface provides hash-based equality checks and ensures that the bindings are updated only when the data has changed meaningfully.INotifyBindablePropertyChanged: This interface triggers updates only when specific property values change.
These interfaces are especially valuable for complex UIs, preventing unnecessary updates when data hasn’t meaningfully changed.
This ScriptableObject shows a sample that implements these optimizations:
[CreateAssetMenu(fileName = "CarData", menuName = "Scriptable Objects/CarData"), GeneratePropertyBag]
public class CarData : ScriptableObject, INotifyBindablePropertyChanged, IDataSourceViewHashProvider
{
    private long _version;

    [SerializeField, DontCreateProperty] string _name;

    public event EventHandler<BindablePropertyChangedEventArgs> propertyChanged;

    `CreateProperty`
    public string Name
    {
        get => _name;
        set
        {
            _name = value;
            _version++;
            Notify();
        }
    }

    void Notify(`CallerMemberName` string property = "")
    {
        propertyChanged?.Invoke(this, new BindablePropertyChangedEventArgs(property));
    }

    public long GetViewHashCode() => _version;
}
This example class uses GeneratePropertyBag to generate a property bag at compile time and CreateProperty to optimize runtime data binding for the Name property.
For change tracking, it implements INotifyBindablePropertyChanged. The Notify method triggers the propertyChanged event whenever Name is updated. This signals changes to the UI and informs any listeners.
The class also implements IDataSourceViewHashProvider. The GetViewHashCode method returns a versioned hash that increases each time Name changes, making it easy to detect updates.
Show and hide elements
When hiding UI elements, simply changing opacity or moving them off-screen isn’t always the best for performance. Even when hidden, these elements still participate in layout calculations, style updates, and data binding operations, potentially impacting performance.
UI Toolkit has a few different ways to hide an element, each with its trade-offs. See this table for a summary.

When hiding UI elements, setting the opacity to 0 or moving them off-screen keeps them visible to the GPU and layout system, with medium to high render costs. These methods are useful for transitions but do not reduce memory or layout overhead.
Setting an element’s visible property to false prevents rendering but keeps it as part of the layout. This is a compromise that temporarily hides the element while using stencil memory.
For more efficient performance, setting the style.display attribute to DisplayStyle.None stops rendering and layout updates entirely. However, this also involves a cost to recalculate the layout when toggling the element back on.
For elements that appear infrequently, like dialog boxes or settings panels, simply remove them from the hierarchy with RemoveFromHierarchy to reduce ongoing overhead. Just be aware that this incurs a higher performance spike when the element is re-added since the layout must be fully rebuilt.
Choose methods based on how frequently elements need to be toggled. Then, balance short-term rendering needs with long-term performance.
Overdraw
UI Toolkit renders elements with transparency, which can result in significant overdraw when elements overlap, as each pixelThe smallest unit in a computer image. Pixel size depends on your screen resolution. Pixel lighting is calculated at every screen pixel. More info
See in Glossary may be processed multiple times. This becomes especially costly with UI Toolkit’s uber shader, which adds complexity to each layer of overlapping elements. Stacking multiple layers of transparent or semi-transparent elements can further impact performance.
Several strategies can help mitigate the performance impact of overdraw:
Use
style.display = DisplayStyle.Noneto hide elements completely instead ofstyle.opacity = 0, which still renders them as transparent.Rather than stacking multiple elements on top of each other, remove or hide any elements that are completely obscured.
When working with scrollable content, implement virtualization through ListViews. ListViews can efficiently render only the visible elements on-screen.
You can also set
style.overflow = Overflow.Hiddento clip content to specific areas, reducing unnecessary rendering outside visible bounds.
Memory management
USS and UXML files reference fonts, textures, and other assets directly. Loading these files pulls all referenced assets into memory, potentially increasing memory usage. Here you can see the assets referenced from an example USS:
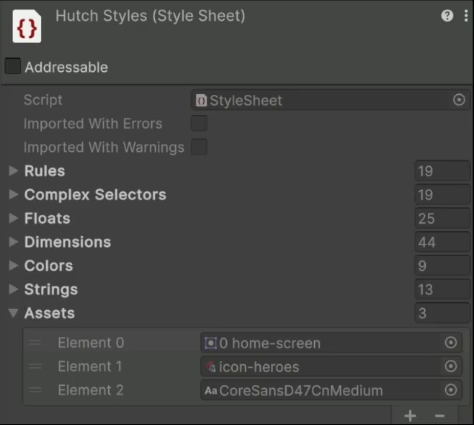
When these assets are imported, they immediately consume memory – even when not in use. This can lead to inefficient memory use if assets aren’t managed properly.
To optimize asset usage, consider these strategies:
-
Use Asset Bundles or Addressables: When possible, only load the UI documents and style sheets required for a particular sceneA Scene contains the environments and menus of your game. Think of each unique Scene file as a unique level. In each Scene, you place your environments, obstacles, and decorations, essentially designing and building your game in pieces. More info
See in Glossary or context. This can help keep memory consumption in check. -
Unload assets when not needed: If a UI element or document is no longer in use, remove it from the hierarchy using
RemoveFromHierarchy. Then, unload it usingAddressables.ReleaseorAssetBundle.Unload(true)to free up memory for other operations. - Selective loading for complex UIs: Break large UXML or USS files into smaller, modular templates (VisualTreeAssets) and load them dynamically as needed. Only loading resources for visible elements helps keep memory usage low.
This technique provides a helpful way to monitor the performance impact of your UI changes and identify whether particular elements might be causing performance bottlenecks.
Profiling tools
Unity provides several tools to identify and resolve UI performance issues in your application.
The Unity Profiler, UI Toolkit Debugger, and Frame Debugger are essential for diagnosing performance issues. These tools help you analyze draw calls, batches, and expensive operations like layout recalculations, style updates, and vertex buffer changes.
For a more granular view of UI changes, use the SetPanelChangeReceiver method from the Panel Settings. This allows you to listen for changes to your UI and track their source. While limited to the Editor and development buildsA development build includes debug symbols and enables the Profiler. More info
See in Glossary, it is useful for isolating specific UI behaviors that might be causing slowdowns.
Here’s an example script that logs every change to the UI:
using UnityEngine;
using UnityEngine.UIElements;

public class PanelChangeReceiver : MonoBehaviour, IDebugPanelChangeReceiver
{
    [SerializeField] PanelSettings m_PanelSettings;

    void Awake()
    {
        m_PanelSettings.SetPanelChangeReceiver(this);
    }

    void OnDestroy()
    {
        m_PanelSettings.SetPanelChangeReceiver(null);
    }

    public void OnVisualElementChange(VisualElement element, VersionChangeType changeType)
    {
        Debug.Log($"{element.name} {changeType}");
    }
}
Simply attach this to a GameObject and set the PanelSettings in the InspectorA Unity window that displays information about the currently selected GameObject, asset or project settings, allowing you to inspect and edit the values. More info
See in Glossary. The OnVisualElementChange method triggers whenever a visual element undergoes a change (e.g., layout, style, transform) and logs a console message. This can help you understand what aspect of the UI is currently being modified.
Unity 6 performance enhancements
Unity 6 introduces a wide array of performance improvements to ensure a smooth and responsive experience in both the Editor and runtime environments:
Event dispatching: Event dispatching rules have been simplified, making them easier to understand and twice as fast.
Mesh generation enhancements: Key improvements include jobified geometry generation for classic element geometry and a transition of the vector API to a native implementation. Text generation is also now parallelized.
Custom Geometry API: A new public API enables developers to generate custom geometry with the same level of performance, allowing for highly optimized UI components.
Deep Hierarchy Layout Performance: Improved caching of layout computations significantly boosts performance in deep hierarchies, providing a smoother user experience.
Optimized TreeView for Large Datasets: The TreeView control, previously inefficient with large datasets, has been enhanced with a new high-performance backend specifically for Entities.
Additional resources
- Community: Unite 2024: Getting the best performance with UI Toolkit
- E-Book: The ultimate guide to profiling Unity games
- E-Book: Optimize your game performance for mobile, XR, and the web in Unity
- E-Book: Optimize your game performance for consoles and PCs in Unity
- E-Book: Optimize your game performance for consoles and PCs in Unity