Inspect UI Toolkit events with Event Debugger
Use the UI Toolkit Event Debugger to inspect and troubleshoot UI events in both Edit and Play mode.
Note: The UI Toolkit Event Debugger is an experimental feature, so it’s still in the process of becoming stable enough to release.
The Event Debugger provides a real-time view of events as they occur, allowing you to analyze event propagation and registered callbacks. This is especially useful for debugging complex event handling scenarios, such as when you have multiple elements with overlapping event handlers or when you’re trying to understand how events propagate through the UI hierarchy.
Enable the Event Debugger
Before you can use the debugger, you must enable it in the project settingsA broad collection of settings which allow you to configure how Physics, Audio, Networking, Graphics, Input and many other areas of your project behave. More info
See in Glossary.
- From the menu, select Edit > Project Settings.
- In the UI Toolkit section, enable UI Toolkit > Advanced > Enable Event Debugger.
Open and set up the Event Debugger
After you enable the Event Debugger, follow these steps to open the debugger and target a specific panel:
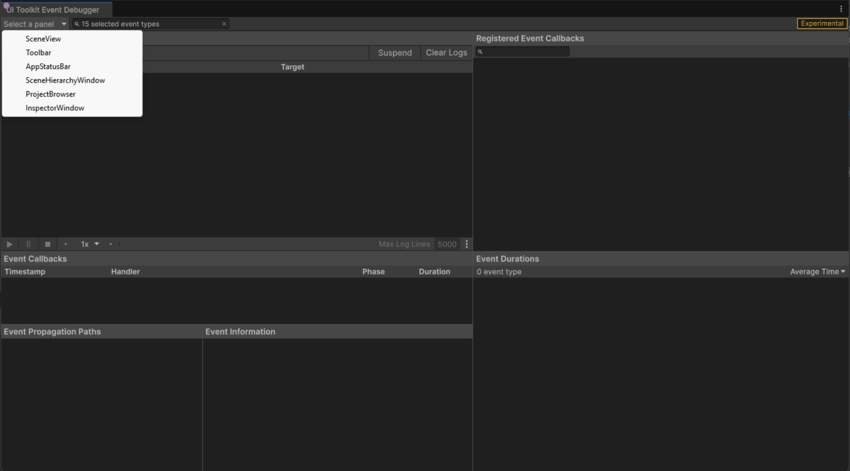
From the menu, select Window > UI Toolkit > Event Debugger to open the UI Toolkit Event Debugger window.
-
Select the panel to debug.
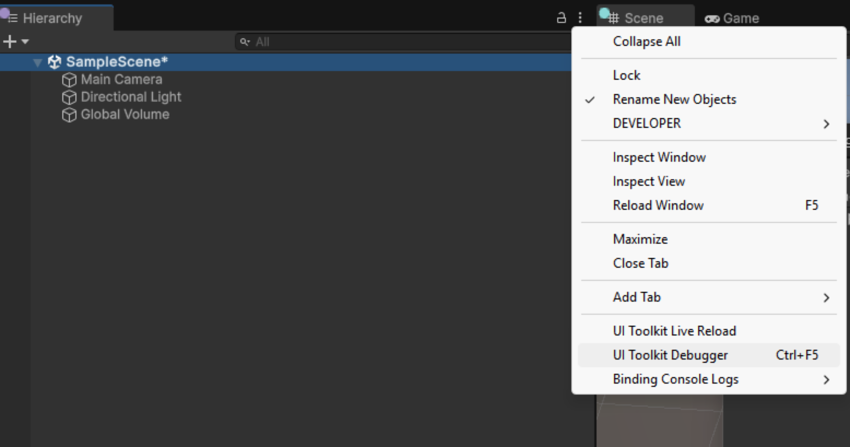
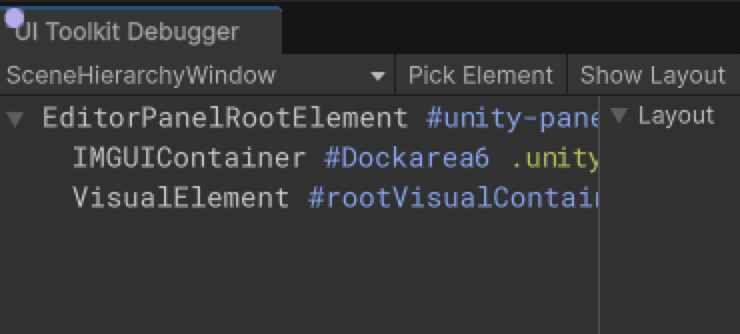
Select a panel Tip: To find a panel’s name, open the UI Toolkit Debugger, focus on the target Editor Window, and then press Ctrl+F5 (macOS: Cmd+F5) or use the More(⫶) menu for that window. The panel name appears in the Debugger’s dropdown, similar to the Select a panel dropdown in the Event Debugger.
Note: To debug runtime panels in Play mode, enter Play mode first and select the target panel.
With the UI Toolkit Event Debugger window open, interact with the panel, such as clicking or moving the mouse. Events appear in the Event Log in real-time.
(Optional) To clear the event log, select Clear Logs in the corner of the UI Toolkit Event Debugger window.
Filter event by type
To reduce the number of events you monitor, filter them by type.
Select the dropdown icon next to the panel selection control to choose which event types to debug. Events are grouped by category, with a count of how often each type has occurred.
By default, Pointer Events are selected. You can toggle entire categories or specific event types.

Analyze event details
When you select an event in the Event Log, the bottom section of the Event Debugger provides detailed information about the event.
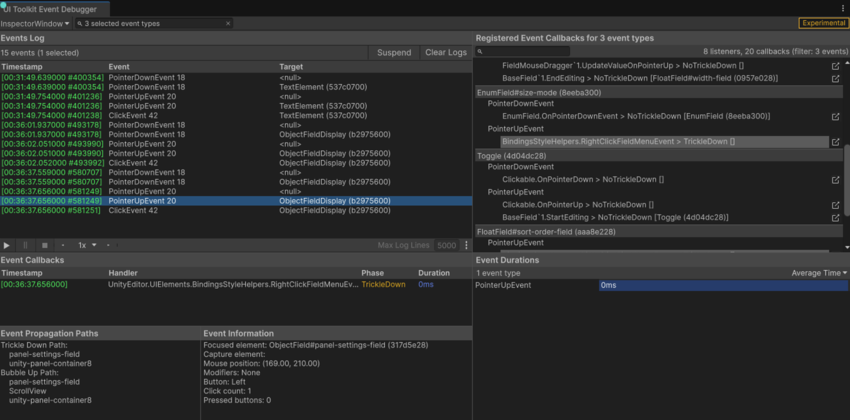
The bottom section of the Event Debugger divides into three main areas:
- Event Callbacks: Lists the C# methods called during the event’s lifecycle.
-
Event Propagation Paths: Shows the element hierarchy involved in event propagation. This includes any element with registered callbacks or overrides such as
HandleEventBubbleUporHandleEventTrickleDown. -
Event Information: Displays context-specific properties, such as:
- Mouse position for pointer events.
- Key code for keyboard events.
- Contextually relevant information, such as the element in focus at the time of the event.
Inspect registered callbacks
To trace event behavior back to your code, use the callback viewer to check what methods are registered and where.
The right panel lists all registered callbacks for the selected event type and panel. Each callback entry includes a diagonal arrow icon that opens your C# code editor at the registration point.
Note: Callbacks are categorized as TrickleDown or NoTrickleDown, depending on their propagation phase. For more information, refer to Dispatch events.