Collect performance data about the Unity Editor
Profile the Unity Editor process to understand the performance of the Editor itself or how the Editor process affects your application in Play mode.
To profile the Editor:
- Open the Profiler (Window > Analysis > Profiler)
- Select the Target Selection dropdown, next to Record
- Select Edit

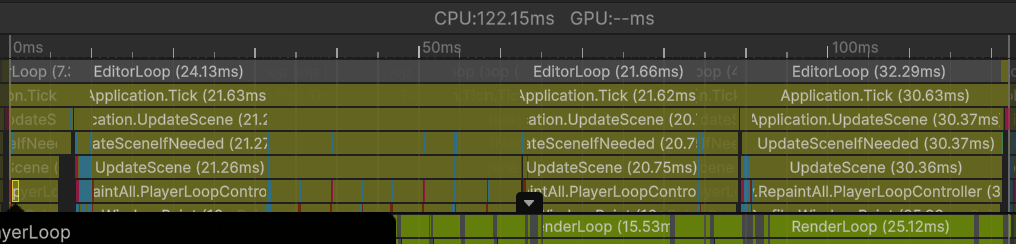
When Editor profiling is enabled every ProfilerA window that helps you to optimize your game. It shows how much time is spent in the various areas of your game. For example, it can report the percentage of time spent rendering, animating, or in your game logic. More info
See in Glossary frame corresponds to one Editor tick which is represented by the Application.Tick sample. However, during Play mode profiling, the Profiler aligns its frames with a player frame, so that you can inspect the composition of EditorLoop markers and compare Play mode frames with or without Editor profiling enabled.
Tip: To reduce the impact that the Profiler window has on Editor performance, open the Profiler window in its own process with the Standalone Profiler. The Standalone Profiler is useful because the Profiler window itself uses resources that might skew the performance data.
Profile the Editor’s startup times
To profile the Editor’s startup times, start the Editor with the command line option -profiler-enable. Refer to Profiler command line arguments for more information.