Troubleshooting on iOS devices
There are some situations with iOSApple’s mobile operating system. More info
See in Glossary where your app works perfectly in the Unity Editor but then doesn’t work or start on the device.The problems are often related to code or content quality. This section describes the most common scenarios.
The game stops responding after a while. Xcode shows “interrupted” in the status bar.
There are a number of reasons why this might happen. Typical causes include:
- Scripting errors such as using uninitialized variables, etc.
- Using third party Thumb compiled native libraries. Such libraries trigger a known problem in the iOS SDK linker and might cause random crashes.
- Using generic types with value types as parameters (e.g. List<int>, List<SomeStruct>, List<SomeEnum>) for serializable script properties.
- Using reflection when managed code stripping is enabled.
- Errors in the native plugin interface (the managed code method signature does not match the native code function signature). Information from the XCode Debugger console can often help detect these problems (Xcode menu: View > Debug Area > Activate Console).
The Xcode console shows "Program received signal: “SIGBUS” or EXC_BAD_ACCESS error.
This message typically appears on iOS devices when your application receives a NullReferenceException. There are two ways to figure out where the fault happened:
Managed stack traces
Unity includes software-based handling of the NullReferenceException. The AOT compiler includes quick checks for null references each time a method or variable is accessed on an object. This feature affects script performance, which is why it is enabled only for development buildsA development build includes debug symbols and enables the Profiler. More info
See in Glossary (enable the script debugging option in Build Settings dialog).
If everything was done right and the fault actually is occurring in .NET code then you won’t see EXC_BAD_ACCESS anymore. Instead, the .NET exception text will be printed in the Xcode console (or else your code will just handle it in a “catch” statement). Typical output might be:
Unhandled Exception: System.NullReferenceException: A null value was found where an object instance was required.
  at DayController+$handleTimeOfDay$121+$.MoveNext () [0x0035a] in DayController.js:122
This indicates that the fault happened in the handleTimeOfDay method of the DayController class, which works as a coroutine. Also, if it is script code then you will generally be told the exact line number (e.g. “DayController.js:122”). The offending line might be something like the following:
Instantiate(_imgwww.assetBundle.mainAsset);
This might happen if, say, the script accesses an asset bundle without first checking that it was downloaded correctly.
Native stack traces
Native stack traces are a much more powerful tool for fault investigation but using them requires some expertise. Also, you generally can’t continue after these native (hardware memory access) faults happen. To get a native stack trace, type bt all into the Xcode Debugger Console. Carefully inspect the printed stack traces; they may contain hints about where the error occurred. You might see something like:
...
Thread 1 (thread 11523):

1. 0 0x006267d0 in m_OptionsMenu_Start ()
1. 1 0x002e4160 in wrapper_runtime_invoke_object_runtime_invoke_void__this___object_intptr_intptr_intptr ()
1. 2 0x00a1dd64 in mono_jit_runtime_invoke (method=0x18b63bc, obj=0x5d10cb0, params=0x0, exc=0x2fffdd34) at /Users/mantasp/work/unity/unity-mono/External/Mono/mono/mono/mini/mini.c:4487
1. 3 0x0088481c in MonoBehaviour::InvokeMethodOrCoroutineChecked ()
...
Firstly, you should find the stack trace for “Thread 1”, which is the main thread. The very first lines of the stack trace will point to the place where the error occurred. In this example, the trace indicates that the NullReferenceException happened inside the OptionsMenu script’s Start method. Looking carefully at this method implementation would reveal the cause of the problem. Typically, NullReferenceExceptions happen inside the Start method when incorrect assumptions are made about initialization order. In some cases only a partial stack trace is seen on the Debugger Console:
Thread 1 (thread 11523):

1. 0 0x0062564c in start ()
This indicates that native symbols were stripped during the Release build of the application. The full stack trace can be obtained with the following procedure:
- Remove application from device.
- Clean all targets.
- Build and run.
- Get stack traces again as described above.
EXC_BAD_ACCESS starts occurring when an external library is linked to the Unity iOS application.
This usually happens when an external library is compiled with the ARM Thumb instruction set. Currently, such libraries are not compatible with Unity. The problem can be solved easily by recompiling the library without Thumb instructions. You can do this for the library’s Xcode project with the following steps:
- In Xcode, select View > Navigators > Show Project Navigator from the menu
- Select the Unity-iPhone project, activate Build Settings tab
- In the search field enter: Other C Flags
- Add -mno-thumb flag there and rebuild the library.
If the library source is not available you should ask the supplier for a non-thumb version of the library.
The Xcode console shows “WARNING -> applicationDidReceiveMemoryWarning()” and the application crashes immediately afterwards
Sometimes, you might see a message like Program received signal: “0”. This warning message is often not fatal and merely indicates that iOS is low on memory and is asking applications to free up some memory. Typically, background processes like Mail will free some memory and your application can continue to run. However, if your application continues to use memory or ask for more, the OS will eventually start killing applications and yours could be one of them. Apple does not document what memory usage is safe, but empirical observations show that applications using less than 50% of all device RAM do not have major memory usage problems. The main metric you should rely on is how much RAM your application uses. Your application memory usage consists of three major components:
- Application code (the OS needs to load and keep your application code in RAM, but some of it might be discarded if really needed)
- Native heap (used by the engine to store its state, your assets, etc. in RAM)
- Managed heap (used by your Mono runtime to keep C# objects)
- GLES driver memory pools: textures, framebuffers, compiled shadersA program that runs on the GPU. More info
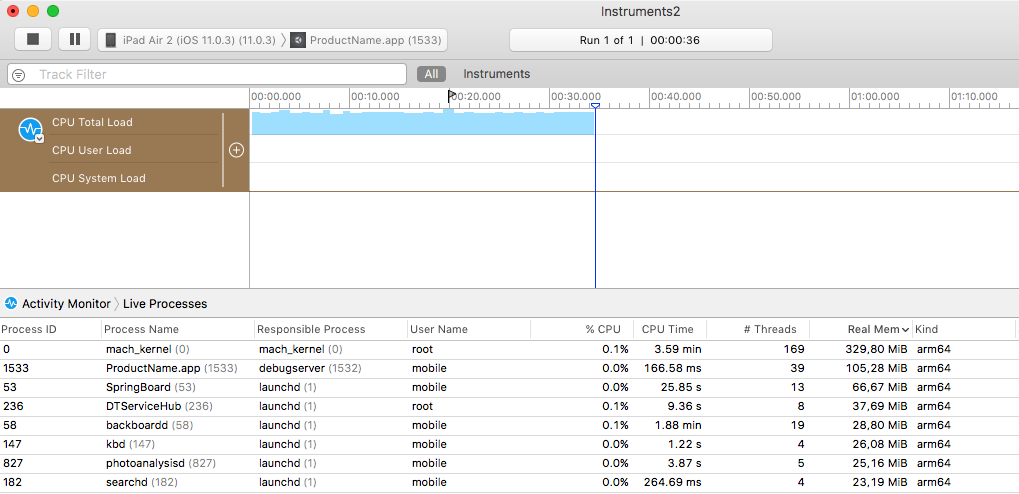
See in Glossary, etc. Your application memory usage can be tracked by two Xcode Instruments tools: Activity Monitor and Allocations. You can start from the Xcode Run menu: Product > Profile and then select specific tool or via Xcode > Open Developer Tools > Instruments. Activity Monitor tool shows all process statistics including Real memory which can be regarded as the total amount of RAM used by your application. Note: OS and device HW version combination might noticeably affect memory usage numbers, so you should be careful when comparing numbers obtained on different devices.
Note: The internal profiler shows only the heap allocated by .NET scriptsA piece of code that allows you to create your own Components, trigger game events, modify Component properties over time and respond to user input in any way you like. More info
See in Glossary. Total memory usage can be determined via Xcode Instruments as shown above. This figure includes parts of the application binary, some standard framework buffers, Unity engine internal state buffers, the .NET runtime heap (number printed by internal profiler), GLES driver heap and some other miscellaneous stuff.
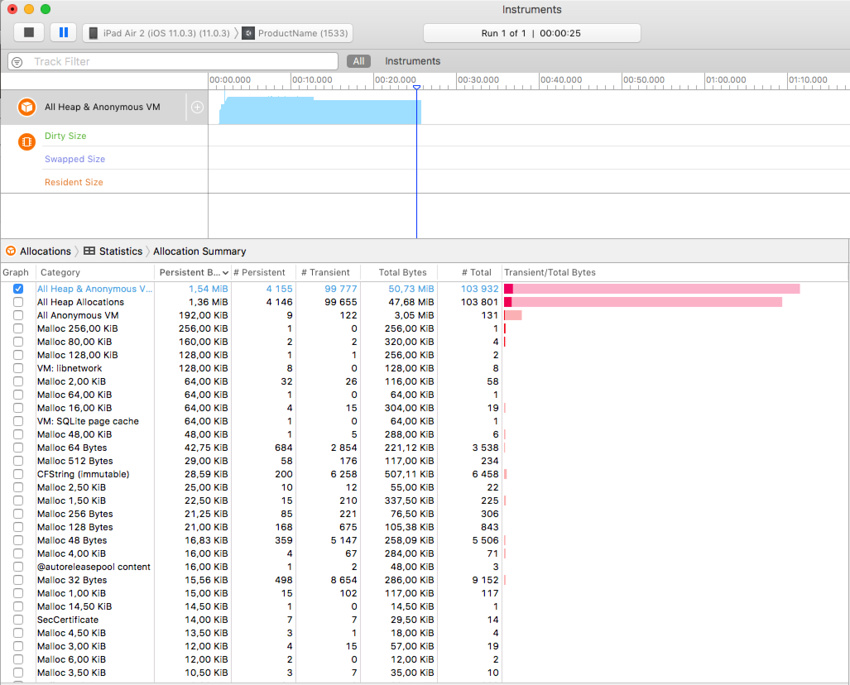
The other tool displays all allocations made by your application and includes both native heap and managed heap statistics. The important statistic is the Net bytes value.
To keep memory usage low:
- Reduce the application binary size by using the strongest iOS stripping options, and avoid unnecessary dependencies
See in Glossary on different .NET libraries. See the Player settings and Optimizing the size of the built iOS Player for further details. - Reduce the size of your content. Use PVRTC compressionA method of storing data that reduces the amount of storage space it requires. See Texture Compression, Animation Compression, Audio Compression, Build Compression.
See in Glossary for textures and use low poly models. See the manual page about reducing file size for more information. - Don’t allocate more memory than necessary in your scripts. Track mono heap size and usage with the internal profiler.
Querying the OS about the amount of free memory may seem like a good idea to evaluate how well your application is performing. However, the free memory statistic is likely to be unreliable since the OS uses a lot of dynamic buffers and caches. The only reliable approach is to keep track of memory consumption for your application and use that as the main metric. Pay attention to how the graphs from the tools described above change over time, especially after loading new levels.
The game runs correctly when launched from Xcode but crashes while loading the first level when launched manually on the device.
There could be several reasons for this. You need to inspect the device logs to get more details. Connect the device to your Mac, launch Xcode and select Window > Devices and Simulators from the menu. Select your device in the window’s left toolbar, then click on the Show the device console button and review the latest messages carefully. Additionally, you may need to investigate crash reports. You can find out how to obtain crash reports here: http://developer.apple.com/iphone/library/technotes/tn2008/tn2151.html.
The Xcode Organizer console contains the message “killed by SpringBoard”.
There is a poorly-documented time limit for an iOS application to render its first frames and process input. If your application exceeds this limit, it will be killed by SpringBoard. This may happen in an application with a first sceneA Scene contains the environments and menus of your game. Think of each unique Scene file as a unique level. In each Scene, you place your environments, obstacles, and decorations, essentially designing and building your game in pieces. More info
See in Glossary which is too large, for example. To avoid this problem, it is advisable to create a small initial scene which just displays a splash screen, waits a frame or two with yield and then starts loading the real scene. This can be done with code as simple as the following:
IEnumerator Start() {
    yield return new WaitForEndOfFrame();
// Do not forget using UnityEngine.SceneManagement directive
    SceneManager.LoadScene("Test");
}
Type.GetProperty() or Type.GetValue() cause crashes on the device
Currently Type.GetProperty() and Type.GetValue() are supported only for the .NET 2.0 Subset profile. You can select the .NET API compatibility level in the Player settings.
Note: Type.GetProperty() and Type.GetValue() might be incompatible with managed code stripping and might need to be excluded (you can supply a custom non-strippable type list during the stripping process to accomplish this). For further details, see the iOS player size optimization guide.
The game crashes with the error message “ExecutionEngineException: Attempting to JIT compile method ‘SometType`1<SomeValueType>:.ctor ()’ while running with –aot-only.”
The Mono .NET implementation for iOS is based on AOT (ahead of time compilation to native code) technology, which has its limitations. It compiles only those generic type methods (where a value type is used as a generic parameter) which are explicitly used by other code. When such methods are used only via reflection or from native code (i.e. the serialization system) then they get skipped during AOT compilationAhead of Time (AOT) compilation is an iOS optimization method for optimizing the size of the built iOS player More info
See in Glossary. The AOT compiler can be hinted to include code by adding a dummy method somewhere in the script code. This can refer to the missing methods and so get them compiled ahead of time.
void _unusedMethod() {
    var tmp = new SomeType<SomeValueType>();
}
Note: Value types are basic types, enums and structs.
Various crashes occur on the device when a combination of System.Security.Cryptography and managed code stripping is used
.NET Cryptography services rely heavily on reflection and so are not compatible with managed code stripping since this involves static code analysis. Sometimes the easiest solution to the crashes is to exclude the whole System.Security.Crypography namespace from the stripping process.
The stripping process can be customized by adding a custom link.xml file to the Assets folder of your Unity project. This specifies which types and namespaces should be excluded from stripping. Further details can be found in the iOS player size optimization guide.
link.xml
<linker>
       <assembly fullname="mscorlib">
               <namespace fullname="System.Security.Cryptography" preserve="all"/>
       </assembly>
</linker>
Application crashes when using System.Security.Cryptography.MD5 with managed code stripping
You should consider the above advice or try working around this problem by adding extra references to specific classes to your script code:
object obj = new MD5CryptoServiceProvider();
“Ran out of trampolines of type 0/1/2” runtime error
This error usually happens if you use lots of recursive generics. You can hint to the AOT compiler to allocate more trampolines of type 0, type 1 or type 2. Additional AOT compiler command line options can be specified in the Other Settings section of the Player settings. For for type 0 trampolines specify ntrampolines=ABCD, where ABCD is the number of new trampolines required (i.e. 4096). For type 1 trampolines specify nrgctx-trampolines=ABCD and for type 2 trampolines specify nimt-trampolines=ABCD.
After upgrading Xcode Unity iOS, runtime fails with message “You are using Unity iPhone Basic. You are not allowed to remove the Unity splash screen from your game”
With some latest Xcode releases there were changes introduced in PNG compression and optimization tool. These changes might cause false positives in Unity iOS runtime checks for splash screen modifications. If you encounter such problems try upgrading Unity to the latest publicly available version. If this does not help, you might consider the following workaround:
- Replace your Xcode project from scratch when building from Unity (instead of appending it)
- Delete already installed projects from device
- Clean project in Xcode (Product > Clean)
- Clear Xcode’s Derived Data folders (Xcode > Preferences > Locations)
If this still does not help try disabling PNG re-compression in Xcode:
- Open your Xcode project
- Select Unity-iPhone project
- Select Build Settings tab
- Look for Compress PNG files option and set to NO
WWW downloads are working fine in Unity Editor and on Android, but not on iOS
The most common mistake is to assume that WWW downloads are always happening on a separate thread. On some platforms this might be true, but you should not take it for granted. Best way to track WWW status is either to use the yield statement or check status in Update method. You should not use busy while loops for that.
“PlayerLoop called recursively!” error occurs when using Cocoa via a native function called from a script
Some operations with the UI(User Interface) Allows a user to interact with your application. More info
See in Glossary will result in iOS redrawing the window immediately (the most common example is adding a UIView with a UIViewController to the main UIWindow). If you call a native function from a script, it will happen inside Unity’s PlayerLoop, resulting in PlayerLoop being called recursively. In such cases, you should consider using the performSelectorOnMainThread method with waitUntilDone set to false. It will inform iOS to schedule the operation to run between Unity’s PlayerLoop calls.
Profiler or Debugger unable to see game running on iOS device
- Check that you have built a Development build, and checked the Script Debugging and Autoconnect Profiler boxes (as appropriate).
- The application running on the device will make a multicast broadcast to 225.0.0.222 on UDP port 54997. Check that your network settings allow this traffic. Then, the profilerA window that helps you to optimize your game. It shows how much time is spent in the various areas of your game. For example, it can report the percentage of time spent rendering, animating, or in your game logic. More info
See in Glossary will make a connection to the remote device on a port in the range 55000 - 55511 to fetch profiler data from the device. These ports will need to be open for TCP access.
Missing DLLs
If your application runs ok in editor but you get errors in your iOS project this may be caused by missing DLLs (e.g. I18N.dll, I19N.West.dll). In this case, try copying those dlls from within the Unity.app to your project’s Assets\Plugins folder. The location of the DLLs within the unity app is: Unity.app\Contents\Frameworks\Mono\lib\mono\unity You should then also check the stripping level of your project to ensure the classes in the DLLs aren’t being removed when the build is optimised. Refer to the iOS Optimisation Page for more information on iOS Stripping Levels.
Xcode Debugger console reports: ExecutionEngineException: Attempting to JIT compile method ‘(wrapper native-to-managed) Test:TestFunc (int)’ while running with –aot-only
Typically, such a message is received when the managed function delegate is passed to the native function, but the required wrapper code wasn’t generated when the application was built. You can help AOT compiler by hinting which methods will be passed as delegates to the native code. This can be done by adding the MonoPInvokeCallbackAttribute custom attribute. Currently, only static methods can be passed as delegates to the native code.
Sample code:
using UnityEngine;
using System.Collections;
using System;
using System.Runtime.InteropServices;
using AOT;

public class NewBehaviourScript : MonoBehaviour {
    [DllImport ("__Internal")]
    private static extern void DoSomething (NoParamDelegate del1, StringParamDelegate del2);

    delegate void NoParamDelegate ();
    delegate void StringParamDelegate (string str);

    [MonoPInvokeCallback(typeof(NoParamDelegate))]
    public static void NoParamCallback() {
        Debug.Log ("Hello from NoParamCallback");
    }

    [MonoPInvokeCallback(typeof(StringParamDelegate))]
    public static void StringParamCallback(string str) {
        Debug.Log(string.Format("Hello from StringParamCallback {0}", str));
    }

    // Use this for initialization
    void Start() {
        DoSomething(NoParamCallback, StringParamCallback);
    }
}
Xcode throws compilation error: “ld : unable to insert branch island. No insertion point available. for architecture armv7”, “clang: error: linker command failed with exit code 1 (use -v to see invocation)”
This error usually means there is just too much code in single module. Typically, it is caused by having lots of script code or having big external .NET assemblies included into build. And enabling script debugging might make things worse, because it adds quite few additional instructions to each function, so it is easier to hit that limit.
Enabling managed code stripping in Player settings might help with this problem, especially if big external .NET assemblies are involved. But if the issue persists then the best solution is to split user script code into multiple assemblies. The easiest way to this is move some code to Plugins folder. Code at this location is put to a different assembly. Also, check the information about how special folder names affect script compilation.
- 2018–06–14 Page amended