Профайлер физики
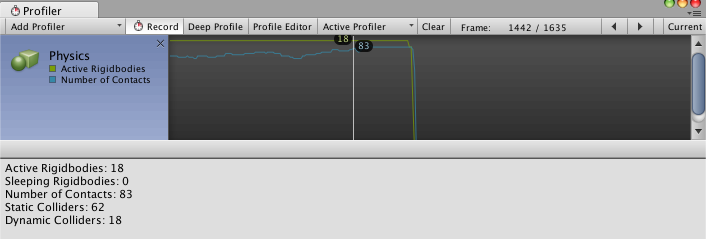
The Physics Profiler displays statistics about physics that have been processed by the physics engine in your Scene. This information can help you diagnose and resolve performance issues or unexpected discrepancies related to the physics in your Scene.
Свойства
| Property: | Function: |
|---|---|
| Active Rigidbodies | The number of Rigidbody components that are moving and not asleep. The number displayed may not be accurate; it only counts those that are processed during the profile time, which may not include all Active Rigidbody components in the Scene. |
| Sleeping Rigidbodies | * Sleeping Rigidbodies - это количество твёрдых тел, находящихся в состоянии покоя. Такие тела не нуждаются в активном обновлении физическим движком (см. Rigidbody Sleeping для дополнительной информации). |
| Number of Contacts | * Number of Contacts - это общее количество точек контакта между всеми коллайдерами в сцене. |
| Static Colliders | * Static Colliders - это количество коллайдеров, которые не относятся к твёрдым телам (т.е., относятся к объектам, которые никогда не перемещаются под действием физических сил). |
| Dynamic Colliders | * Dynamic Colliders - это количество коллайдеров, относящихся к твёрдым телам (то есть, к объектам, которые перемещаются под действием физических сил). |
Note: The Physics Profiler might not count every GameObject that has a physics-based component; it only counts GameObjects that have been processed by the physics engine. To calculate the exact number of GameObjects with specific physics components attached, write a custom script using the FindObjectsOfType function.
Using the Physics Profiler to understand performance issues
The physics simulation runs on a separate fixed frequency update cycle from the main logic’s update loop, and can only advance time via a Time.fixedDeltaTime per call. This is similar to the difference between Update() and FixedUpdate() (see documentation on the Time Manager for more).
When a heavy logics or graphics frame occurs that takes a long amount of time, the Physics Profiler has to call the physics simulation multiple times per frame. This means that an already resource-intensive frame takes even more time and resources, which can easily cause the physics simulation to temporarily stop due to the Maximum Allowed Timestep value (which can be set in Edit > Project Settings > Time).
You can detect this in your project by selecting the CPU Usage Profiler and checking the number of calls for Physics.Processing or Physics.Simulate in the Overview section.
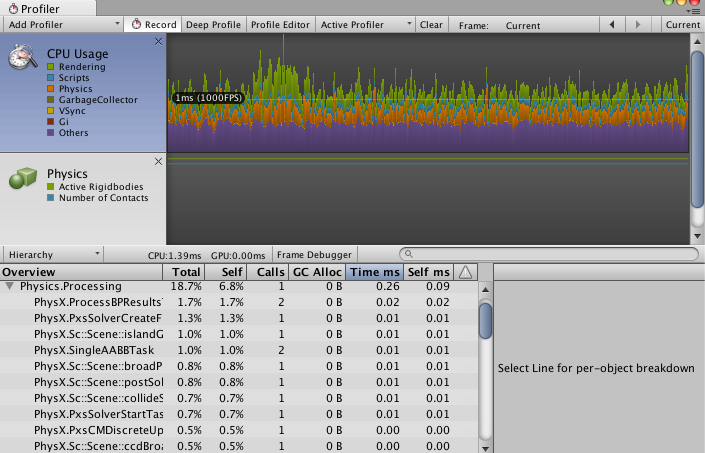
In this example image, the value of 1 in the Calls column indicates that the physics simulation was called one time over the last logical frame.
A call count close to 10 might indicate an issue. As a first solution, reduce the frequency of the physics simulation; if the issue continues, check what could have caused the heavy frame right before the Physics Profiler had to use that many simulation calls in order to catch up with the game time. Sometimes, a heavy graphics frame may cause more physics simulation calls later on in a Scene.
For more detailed information about the physics simulation in your Scene, click the triangle arrow to expand Physics.Processing as shown in the screenshot above. This displays the actual names of the physics engine tasks that run to update your Scene. The two most common names you’re likely to see are:
Pxs: short for ‘PhysX solver’, which are physics engine tasks required by joints as well as resolving contacts for overlapping bodies.
ScScene: used for tasks required for updating the Scene, running the broad phase and narrow phase, and integrating bodies (moving them in space due to forces and impulses). See Steven M. LaValle’s work on Planning Algorithms for a definition on two-phase collision detection phases.