물리 프로파일러
물리 프로파일러는 씬에서 물리 엔진으로 처리된 물리에 대한 통계를 표시합니다. 이 정보는 성능 문제나 씬의 물리와 관련된 예기치 못한 불일치를 진단 및 해결하는 데 유용할 수 있습니다.
프로퍼티
| 프로퍼티: | 기능: |
|---|---|
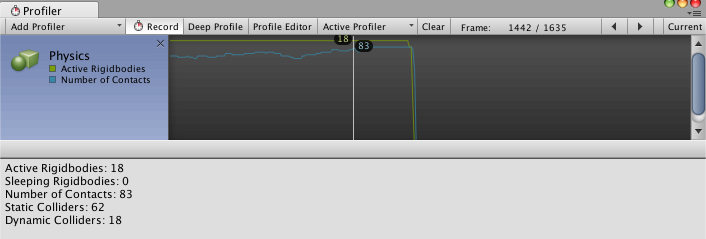
| Active Rigidbodies | The number of Rigidbody components that are moving and not asleep. The number displayed may not be accurate; it only counts those that are processed during the profile time, which may not include all Active Rigidbody components in the Scene. |
| Sleeping Rigidbodies | The number of Rigidbody components that are not engaging with the physics engine, and therefore do not need to be actively processed (see Rigidbody overview: Sleeping for further information). The number displayed here may not be accurate. |
| Number of Contacts | The total number of points of contact between all colliders in the Scene. |
| Static Colliders | The number of colliders attached to GameObjects without Rigidbody components. These GameObjects never move using a physics component. |
| Dynamic Colliders | The number of colliders attached to GameObjects with Rigidbody components. These GameObjects do move using a physics component. |
Note: The Physics Profiler might not count every GameObject that has a physics-based component; it only counts GameObjects that have been processed by the physics engine. To calculate the exact number of GameObjects with specific physics components attached, write a custom script using the FindObjectsOfType function.
물리 프로파일러를 사용하여 성능 문제 파악
The physics simulation runs on a separate fixed frequency update cycle from the main logic’s update loop, and can only advance time via a Time.fixedDeltaTime per call. This is similar to the difference between Update() and FixedUpdate() (see documentation on the Time Manager for more).
시간이 오래 걸리는 무거운 로직 또는 그래픽스 프레임이 발생하면 물리 프로파일러에서 물리 시뮬레이션을 프레임마다 여러 번 호출해야 합니다. 따라서 이미 리소스를 많이 사용하는 프레임에 더욱 많은 시간과 리소스가 필요하기 때문에 물리 시뮬레이션이 Maximum Allowed Timestep 값(Edit > Project Settings > __Time__에서 설정 가능)에 따라 일시적으로 중단되기 쉽습니다.
You can detect this in your project by selecting the CPU Usage Profiler and checking the number of calls for Physics.Processing or Physics.Simulate in the Overview section.
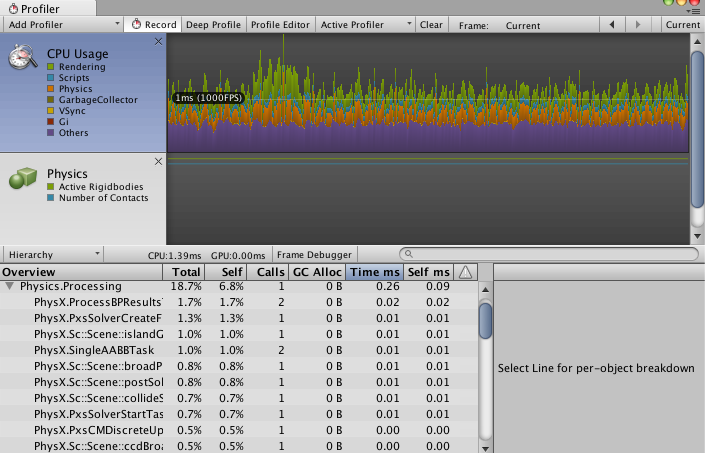
In this example image, the value of 1 in the Calls column indicates that the physics simulation was called one time over the last logical frame.
호출 카운트가 10에 가까우면 문제가 있음을 의미합니다. 문제를 해결하려면 먼저 물리 시뮬레이션 빈도를 줄이십시오. 문제가 계속되면 (물리 프로파일러가 게임 타임에 보조를 맞추기 위해)많은 시뮬레이션 호출을 사용하기 직전에 무거운 프레임을 초래할 수 있는 원인을 확인해야 합니다. 때로는 무거운 그래픽스 프레임으로 인해 나중에 씬에서 물리 시뮬레이션이 더 많이 호출될 수 있습니다.
씬의 물리 시뮬레이션에 대한 자세한 내용을 확인하려면 위 스크린샷처럼 삼각형 화살표를 클릭하여 Physics.Processing 을 확장합니다. 그러면 씬을 업데이트하기 위해 실행되는 물리 엔진 작업의 실제 이름이 표시됩니다. 가장 많이 표시되는 이름은 다음과 같습니다.
Pxs: ‘PhysX solver’의 약어로, 조인트에 필요한 물리 엔진 작업입니다. 겹치는 바디의 접촉을 확인하는 데도 필요합니다.
ScScene: 씬을 업데이트하고 넓은 페이즈와 좁은 페이즈를 실행하고 바디를 통합(힘과 충격으로 인해 공간에서 바디 이동)하는 데 필요한 작업에 사용됩니다. 2 페이즈 충돌 검사 페이즈의 정의는 계획 알고리즘에 대한 Steven M. LaValle의 연구를 참조하십시오.