Warning
Warning: Unity Simulation is deprecated as of December 2023, and is no longer available.
Visualize Sensor Data
You can visualize incoming and outgoing messages, such as sensor data, navigation messages, markers, and more within Unity using the visualization suite in the Simulation Foundation package. The visualization suite includes default configurations for common message types, as well as APIs so you can create your own custom visualizations.
Configure a visualization suite
A visualization suite contains components that control how messages are displayed in the Unity scene. We have provided two visualization suites.
The
DefaultVisualizationSuiteprefab (located atPackages/com.unity.simulation.foundation/Runtime/Visualizations/Prefabs/DefaultVisualizationSuite.prefab) provides visualizer components for many common message types.The
EmptyVisualizationSuiteprefab (located atPackages/com.unity.simulation.foundation/Runtime/Visualizations/Prefabs/EmptyVisualizationSuite.prefab), contains the necessary components to add visualizations, but none of the default visualizers so you may pick and choose which visualizers you want in the scene.
To enable visualizations:
- Drag and drop a visualization suite prefab into your scene hierarchy.
- Ensure your scene has a GameObject with an
IConnectorcomponent in it. If it does not, add a GameObject with aDummyConnectionComponenton it. - Use the
Topicsbutton in the Visualizations HUD to toggle the topics for which you want to visualize the received message. - (Optional) Locate a visualizer in the visualization suite GameObject hierarchy and configure its settings in the Inspector.
The UI windows for visualizations will automatically be laid out as they are turned on, but can be moved and resized. The visualizations in the scene can be customized as described in the following sections.
Visualizations HUD
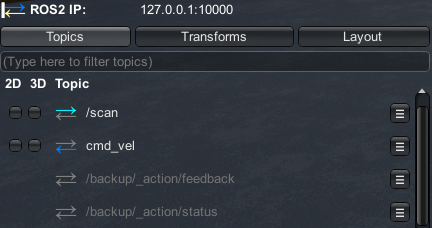
The visualizations HUD provides a GUI to toggle visualizations.
The Visualization HUD is located on the top-left panel in the Game view and provides a GUI to toggle visualizations. It includes:
Topics: Contains a list of all topics on which this current session has sent or received a message. The
2Dtoggle enables a window that shows the last message sent or received on that topic. The3Dtoggle enables an in-scene drawing that represents the last message sent or received on that topic. If no toggle is available, that topic does not have a default visualizer enabled in the Unity scene.- Topics that appear white are of a message type that has a visualizer component in the scene, i.e. a
DefaultVisualizercomponent or a custom visualizer script attached to a GameObject in the scene. This can include a 2D window, a 3D drawing, or both. In the example screenshot above, this is/scan, orcmd_vel. - Topics that appear grey are of a message type that does not currently have a visualizer component in the scene. In the example screenshot above, this is
/backup/_action/feedback, or/backup/_action/status. - The Topics tab also contains a search bar that allows you to search for topics.
- Topics that appear white are of a message type that has a visualizer component in the scene, i.e. a
Transforms: Contains
tfvisualization options, including displaying the axes, links, and labels for each frame.Layout: Contains options to save and load this visualization configuration. The visualization components are by default saved via the scene or the prefab, the window layout and visualized message list is saved as a JSON file. By default, this file is saved to a
RosHudLayout.jsonfile on your machine'sApplication.persistentDataPathand loaded on each session. In this Layout tab, you can choose toExportthis JSON file with a custom name to a chosen location on your device, as well asImporta layout JSON file to begin using that saved visualization configuration.
Configuring the visualization settings
The visualizers for each message type are added as components to a GameObject in the scene. In the DefaultVisualizationSuite, each individual default visualizer can be found by expanding the hierarchy and finding the game object with the name corresponding to the message type's package, e.g. Geometry for geometry_msgs.
The 3D visualizations offer customizations such as label and color fields, which will modify the drawing in the scene. Visualizations including lines or arrows (e.g. sensor_msgs/Imu) provide options for the length and thickness of the arrow as well as the radius around which any curved arrows are drawn. These customizations will be specific to each message type. Please note that changes to these settings will not be saved during runtime, and you will have to exit Play mode to save these modifications.
Note
Size-related fields are in Unity coordinates, where 1 unit = 1 meter.
Message Topics
Visualizations, by default, are created based on message types. However, you can also directly assign a topic in the visualizer component's Inspector--you can find the <Type> Default Visualizer component by expanding the DefaultVisualizationSuite GameObject in the Hierarchy and selecting the child object for the package. In the Inspector window, you will see all the default visualizers provided for this package (you may need to scroll down to see all added components).
The Topic field can be specifically assigned to customize visualizations for only that topic. This is particularly useful for adding multiple default visualizers of the same message type, customized for different topics.
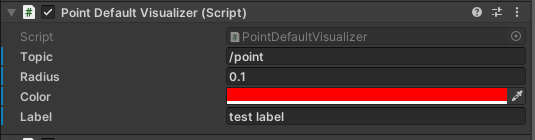
Example inspector for the point default visualization.
TF Topics and Tracking
There are three options, found via the TF Tracking Settings, for how to visualize messages with stamped headers with respect to the TF tree.
Tracking Type - Track Latest: This setting reads the frame_id from the message header, queries the transform tree for the latest transform from that parent link, and draws the visualization with respect to that transform. With this setting, the drawing object will appear as a child GameObject of the GameObject corresponding to the proper frame_id. The drawing will have a zeroed local position and rotation, and the frame GameObject will be transformed based on the latest transform information.
Tracing Type - Exact: This setting reads the frame_id from the message header, queries the transform tree for the transform corresponding to the exact timestamp in the header, and draws the visualization with respect to that transform. With this setting, the the drawing object will appear as a child of the BasicDrawingManager. Its Transform will remain zero throughout the simulation, while its parent object’s Transform will show the value of the transform queried as described.
Tracking Type - None: This setting ignores the message header and draws messages with respect to the Unity's origin by setting the local position of the drawing to Vector3.zero and the local rotation to be Quaternion.identity. With this setting, the drawing object will appear in the BasicDrawingManager, and you’ll see that its Transform (Position and Rotation) remain zero throughout the simulation.
Additionally, it is important to track 3D visualizations in the proper coordinate frames.
TF Topic: By default, the TF Topic is assigned to /tf, but this can be replaced with a different or namespaced TF topic.
Joy Messages
This package contains preconfigured button maps for the Xbox 360 wired and wireless controllers for Windows and Linux mappings, provided as ScriptableObjects in the Runtime/Visualizations/DefaultVisualizers/Sensor directory.
You can create your own custom mapping for the Joy Default Visualizer by right-clicking in the Project window under Create > Robotics > Sensor Visualizers > Joy. Once the file is made, you can click into the asset and manually assign the button or axis index appropriate for your custom controller.
Once the mapping is done, in your Joy Default Visualizer component (e.g. DefaultVisualizationSuite/Sensor/JoyDefaultVisualizer), assign the Settings field to your newly made button map.
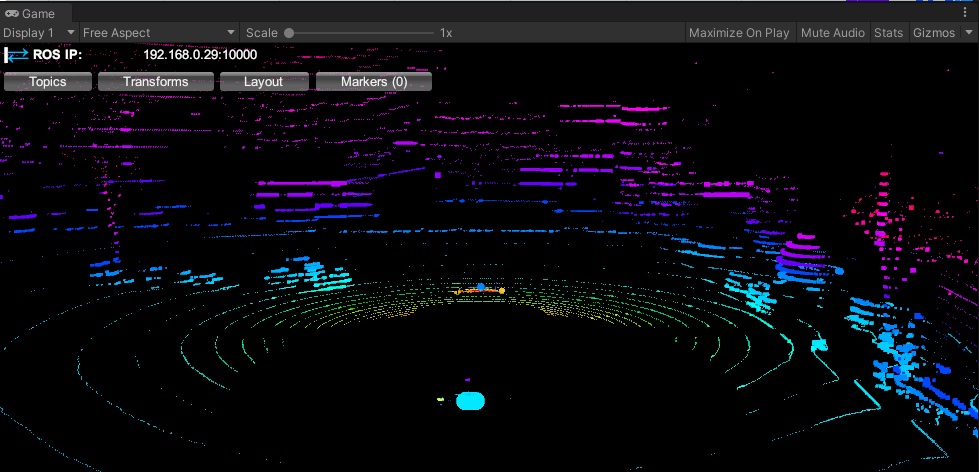
Point Clouds
Note
When visualizing point clouds on a URP project, make sure the project's active SRP settings are correctly configured. To do so, go to Edit > Project Settings > Graphics and check what is selected in the Scriptable Render Pipeline Settings field (e.g. URP-Balanced, URP-HighFidelity or URP-Performant). Then find the corresponding -Renderer Asset in the Assets/Settings folder and make sure the following settings are set:
Depth Priming Modeis set toDisabledIntermediate Textureis set toAlways
Similar to the Visualization Settings, point cloud visualizations are highly customizable. Settings for these visualizers (PointCloud, LaserScan, etc.) will be saved during runtime. For more information on this, you can check out the base SettingsBasedVisualizer class (under Editor/Visualizations/SettingsBasedVisualizerEditor.cs), as well as read more about Unity's ScriptableObjects.
The standard settings are provided in ScriptableObjects. Default settings are provided in the Resources/VisualizerSettings directory, and can be created by right-clicking in the Project window under Create > Robotics > Sensor Visualizers. After being created, this configuration can be dragged and dropped into the component's Inspector field Visualizer settings, or selected by clicking on the small circle to the right of the field.
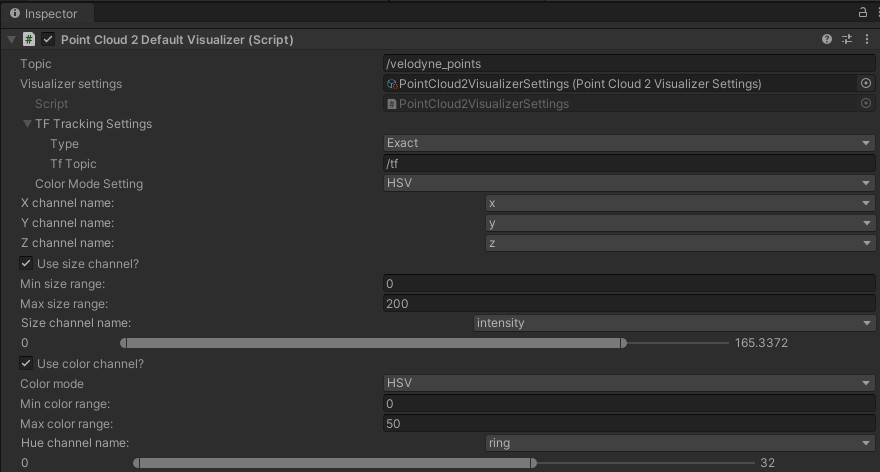
The settings available will depend on the message type.
Channel Name: These settings allow you to choose which channel name corresponds to X, Y, Z, and color channels.
Size: Each point is by default a uniform size. This toggle allows you to select a channel that defines the size of each drawn point, e.g. using intensity to assign scale based on each point's intensity reading.
Color: The color options enable the point clouds to be drawn with configurable colors.
The
HSVoption allows you to choose a channel that will be automatically converted to colored points. This can be useful for visualizing individual lasers like a lidar'sringchannel, for example.The
Combined RGBoption is used for channels that should specifically be parsed into RGB data, e.g.rgbchannels.The
Separate RGBis similar to the HSV option, but assigns a different channel to each R, G, and B color channel, which may be used for visualizing X, Y, and Z axes, for example.
Range: The min and max value fields configure the ranges for the sliding bar provided. This setting is applied to the respective range field.
Visualizing Intensity
Intensity is a fourth channel within the point cloud data. To visualize it, you can change the point color to correspond to different ranges of intensity. To do this, choose Use Color Channel, and select Separate RGB. Change all three channels to intensity. Note that you will have to run the scene and visualize the point cloud to populate the fields prior to selecting intensity. Then, simply change each channel's range to consecutive ranges. For example, you might change the ranges to R: 0-0.5, G: 0.5-1.5, B: 1.5-10, if the lidar's Intensity is set to 10.
Priority Setter
The Priority Setter component allows users to modify which visualization is preferred, in case of multiple visualizers per message type. All default visualizers default to priority -1, and custom visualizers will default to 0, making custom visualizers a higher priority. This means that, when toggling on visualizations in the scene, the higher priority visualizers will be turned on.
To use the Priority Setter, simply add the PrioritySetter component to the GameObject that holds the visualization you want to modify, and set its Priority field value.
Visualizations in Distributed Rendering
When using Distributed Rendering, it is possible to view visualizations on Render Nodes with the Activate Visualizations component. The component also allows users to visualize image topics in fullscreen on a Render Node.
To use the Activate Visualizations component, add it to the sensor GameObject that you want to visualize on a render node, and set the Topic Name field to the topic you would like to visualize.
Check Enable 2d to enable the 2D visualization of the topic on the render node during runtime.
Check Fullscreen 2d Image if visualizing a 2D topic with an image to make it appear fullscreen during runtime.
Check Enable 3d to enable the 3D visualization of the topic on the render node during runtime.
Create a custom visualizer
All aspects of the HUD is also designed to be customizable; you may add custom tabs or headers to the HUD by adding a custom script similar to the VisualizationLayoutTab to extend the HUD.
Sample code to create a custom visualizer
using System;
using System.Collections.Generic;
using UnityEngine;
using Unity.Simulation.Foundation;
using Unity.Simulation.Foundation.GeometryMessages; // Generated message classes
using Unity.Simulation.Foundation.Visualizations;   // Visualizations

/*
1. Declare a new visualizer class
A visualizer that manages multiple drawings over time for a specific message type
should inherit from the HistoryDrawingVisualizer<T> class.
*/

public class PoseTrailVisualizer : HistoryDrawingVisualizer<PoseStampedMsg>
{

/*
2. Declare visualizer settings
Define customizable parameters (line color, thickness, and label) for the trail
drawing as serialized private fields at the top of your PoseTrailVisualizer class.
*/
    [SerializeField]
    Color m_Color = Color.white;
    [SerializeField]
    float m_Thickness = 0.1f;
    [SerializeField]
    string m_Label = "";

/*
3. Configure the UI window for the visualizer
In the Visualizations Package, UI windows are registered based on its topic,
and will update whenever a message is sent or received on it.
The visualizer base class (in this case, HistoryDrawingVisualizer) manages all of this already.
So all you have to add is toformat the message contents in the window.
*/
    public override Action CreateGUI(IEnumerable<Tuple<PoseStampedMsg, MessageMetadata>> messages)
    {
        return () =>
        {
            var count = 0;
            foreach (var (message, meta) in messages)
            {
                GUILayout.Label($"Pose #{count}:");
                message.pose.GUI();
                count++;
            }
        };
    }

/*
4. Add the Draw method
Override the Draw() method for updating a 3D drawing in the Unity scene.
The HistoryDrawingVisualizer manages multiple messages over time and updates
and cleans up the message drawings, so all we'll have to do is feed the pose messages in.
*/
    public override void Draw(Drawing3d drawing, IEnumerable<Tuple<PoseStampedMsg, MessageMetadata>> messages)
    {
        var firstPass = true;
        var prevPoint = Vector3.zero;
        var color = Color.white;
        var label = "";
/*
5. Draw the trail
Iterate through the set of saved messages in order to update the line drawing,
drawing each segment along the way using the utilities provided for Drawing.
*/
        foreach (var (msg, meta) in messages)
        {
            var point = msg.pose.position.From<FLU>();
            if (firstPass)
            {
                color = VisualizationUtils.SelectColor(m_Color, meta);
                label = VisualizationUtils.SelectLabel(m_Label, meta);
                firstPass = false;
            }
            else
            {
                drawing.DrawLine(prevPoint, point, color, m_Thickness);
            }

            prevPoint = point;
        }

/*
6. Draw labels
Update the position of the text label to be at the most updated position.
*/
        drawing.DrawLabel(label, prevPoint, color);
    }
}

/*
7. Test your visualization!
Your new visualizer is ready to fully test.
 - In the Unity Editor's Hierarchy view, select your visualization suite,
   make a new GameObject named TrailVisualizer (e.g. DefaultVisualizationSuite/TrailVisualizer).
 - Add the newly created PoseTrailVisualizer component to the TrailVisualizer GameObject.
 - You can modify the thickness, color, and label of the visual in the PoseTrailVisualizer's Inspector window.
*/