SystemGraph debugger
SystemGraph contains a debugger to help diagnose and identify problems within the architecture.
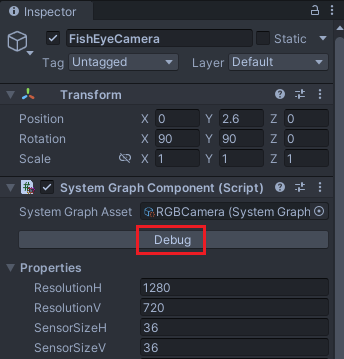
Launch the debugger from the inspector
You can launch the debugger when you are in Play mode. To launch the debugger:
- Select in the Hierarchy window a GameObject with a System Graph Component.
- Select Debug in the Inspector window to open a debugger window.

Main debugger window
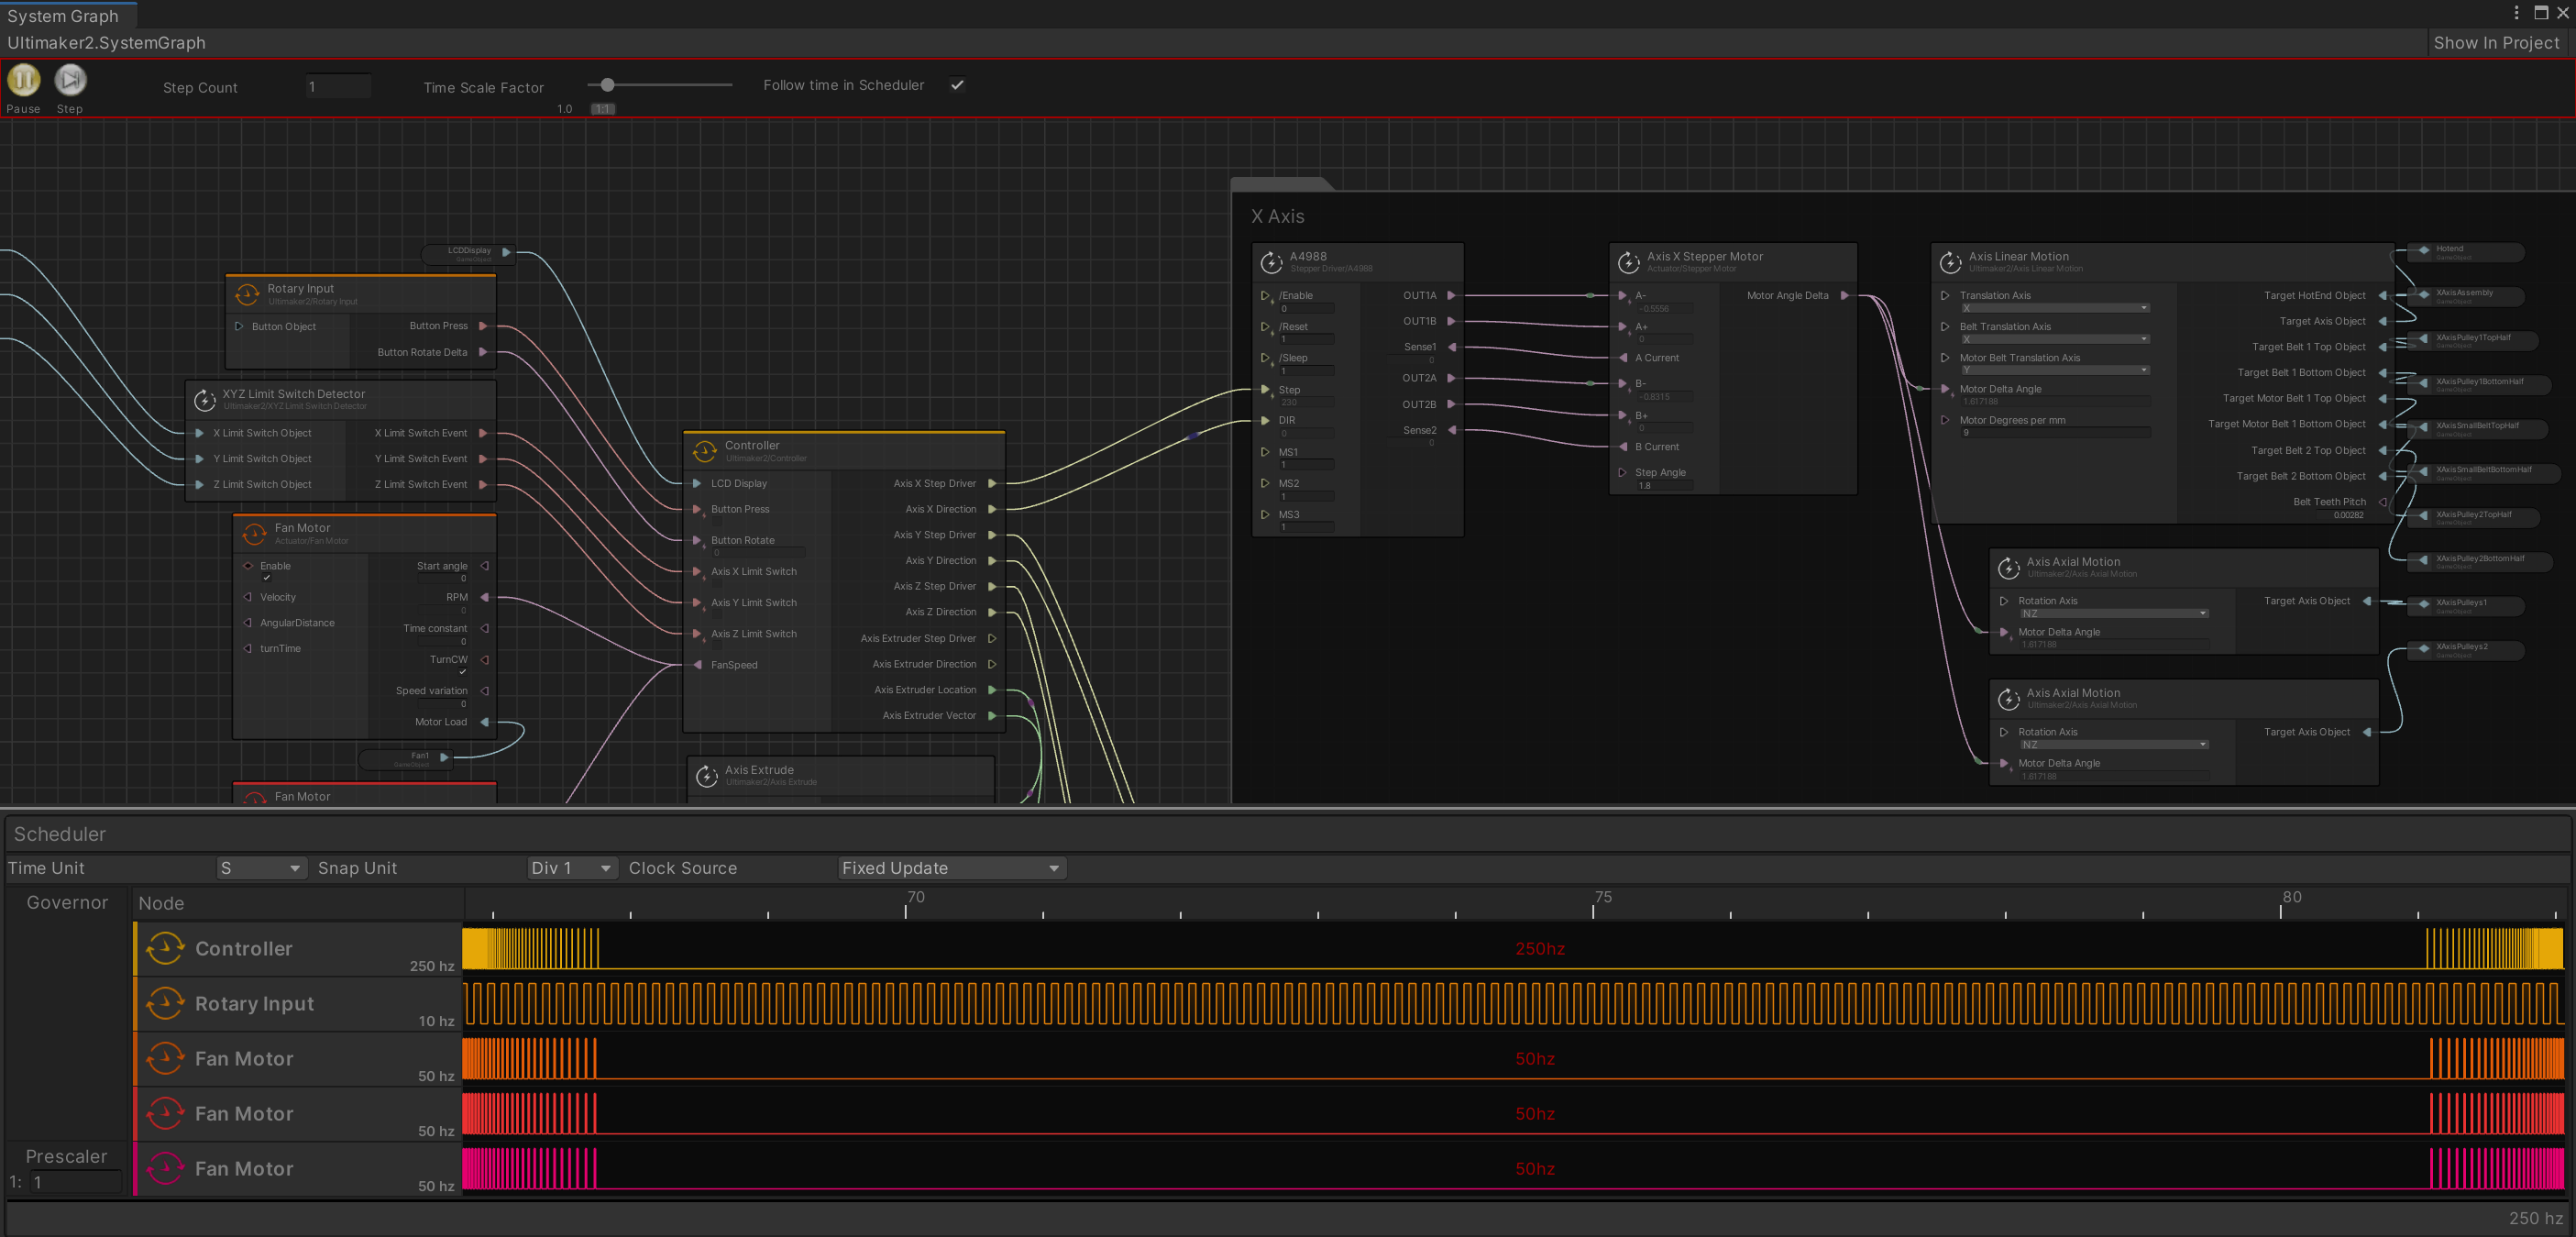
In the debugger window, the scheduler displays the current time of emulation and the waveforms for this time range. The data in the node ports display the current values; an animation on the edges appears when information is propagated between nodes in real time. The user can pause, step or change the time dilation of the emulation by using the debugger panel at the top of the SystemGraph Editor.

Interaction
A system graph is in read-only mode when debugging. You can only interact with the top debugger context menu. You can change the Time Unit of the scheduler to change the update rate of the displayed waveforms.
Pause Button: Stops the SystemGraph instance from updating. This pauses the scheduler, but all nodes that received Unity lifecycle events are still handled.
Step Button: Available when paused. When selected, the scheduler pauses after it executes the next rising edge of a waveform. This makes it possible to debug a graph and see the node outputs for single events.
Step Count: Defines the number of steps to execute for every click of the step button.
Time Scale Factor slider: Modifies the time factor of this graph instance. It can slow down or accelerate execution of the scheduler events.
Follow time in Scheduler: Activates the scheduler scrolling when checked.
