Collecting and viewing data workflow
Follow this workflow to populate the Unity Profiler and Profile Analyzer with profiling data for performance analysis.
The Profile Analyzer analyzes CPU timing from the Unity Profiler and GC.Alloc marker data for the GC allocation panels.
Note
Captures taken with Unity versions that predate the GC.Alloc profiler marker, or captures that never recorded one in the selected range, display No GC allocation data in capture in the GC allocation panels.
To populate the Profiler and Profile Analyzer with profiling data, complete the following tasks in order:
- Open the Unity Profiler
- Populate the Profiler with data
- Pull data into the Profile Analyzer
- Load and save Profile Analyzer data
Open the Unity Profiler
The Unity Profiler must be open before you record or load a capture.
To open the Unity Profiler:
- In the Unity Editor, go to Window > Analysis > Profiler, or press Ctrl+7 (macOS: Cmd+7).
- If the Profile Analyzer window is already open, select Open Profiler Window instead.
Populate the Profiler with data
The Profile Analyzer reads data from the Profiler. Record a new capture or load an existing .data file before you pull data into the Profile Analyzer.
Record new data
To record new profiling data:
- At the top of the Profiler window, open the Attach to Player dropdown (next to Record) and select a player to profile. The default target is Playmode.
- Select Record to start recording.
If you enabled Autoconnect Profiler in Build Settings, the Profiler records data automatically when you start a built player.
Refer to Profiling your application for more recording options.
Load data
To load a saved Profiler capture:
- In the Profiler window, select Load.
- Choose a
.datafile.
Pull data into the Profile Analyzer
To pull Profiler data into the Profile Analyzer:
- Open the Profile Analyzer window (Window > Analysis > Profile Analyzer).
- In the Frame Control pane, select Pull Data.
The Profile Analyzer imports the frames currently loaded in the Profiler.
Tip
The Profiler window and the Profile Analyzer window use a lot of screen space. Dock both windows in one tabbed layout to switch between them quickly.
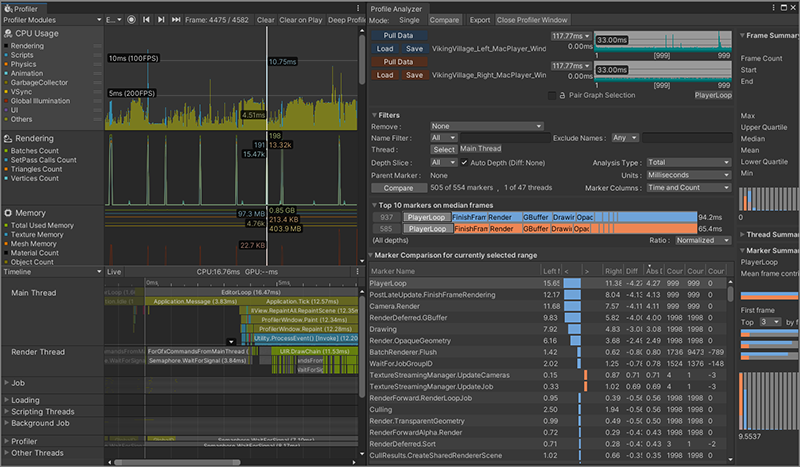
The Profile Analyzer in Compare view docked next to the Profiler in one window
Load and save Profile Analyzer data
Profile Analyzer saves analysis in the .pdata format, separate from Profiler .data captures.
To save Profile Analyzer data:
- In any view, select Save.
- Choose a location. Unity writes a
.pdatafile.
To load Profile Analyzer data:
- In any view, select Load.
- Choose a
.pdatafile.
Note
Profile Analyzer Load accepts .pdata files only. To analyze a Profiler .data capture, open it in the Profiler first, then select Pull Data in the Profile Analyzer.
After you load or save data, analyze it in the Profile Analyzer window or continue with other pages under Workflows.