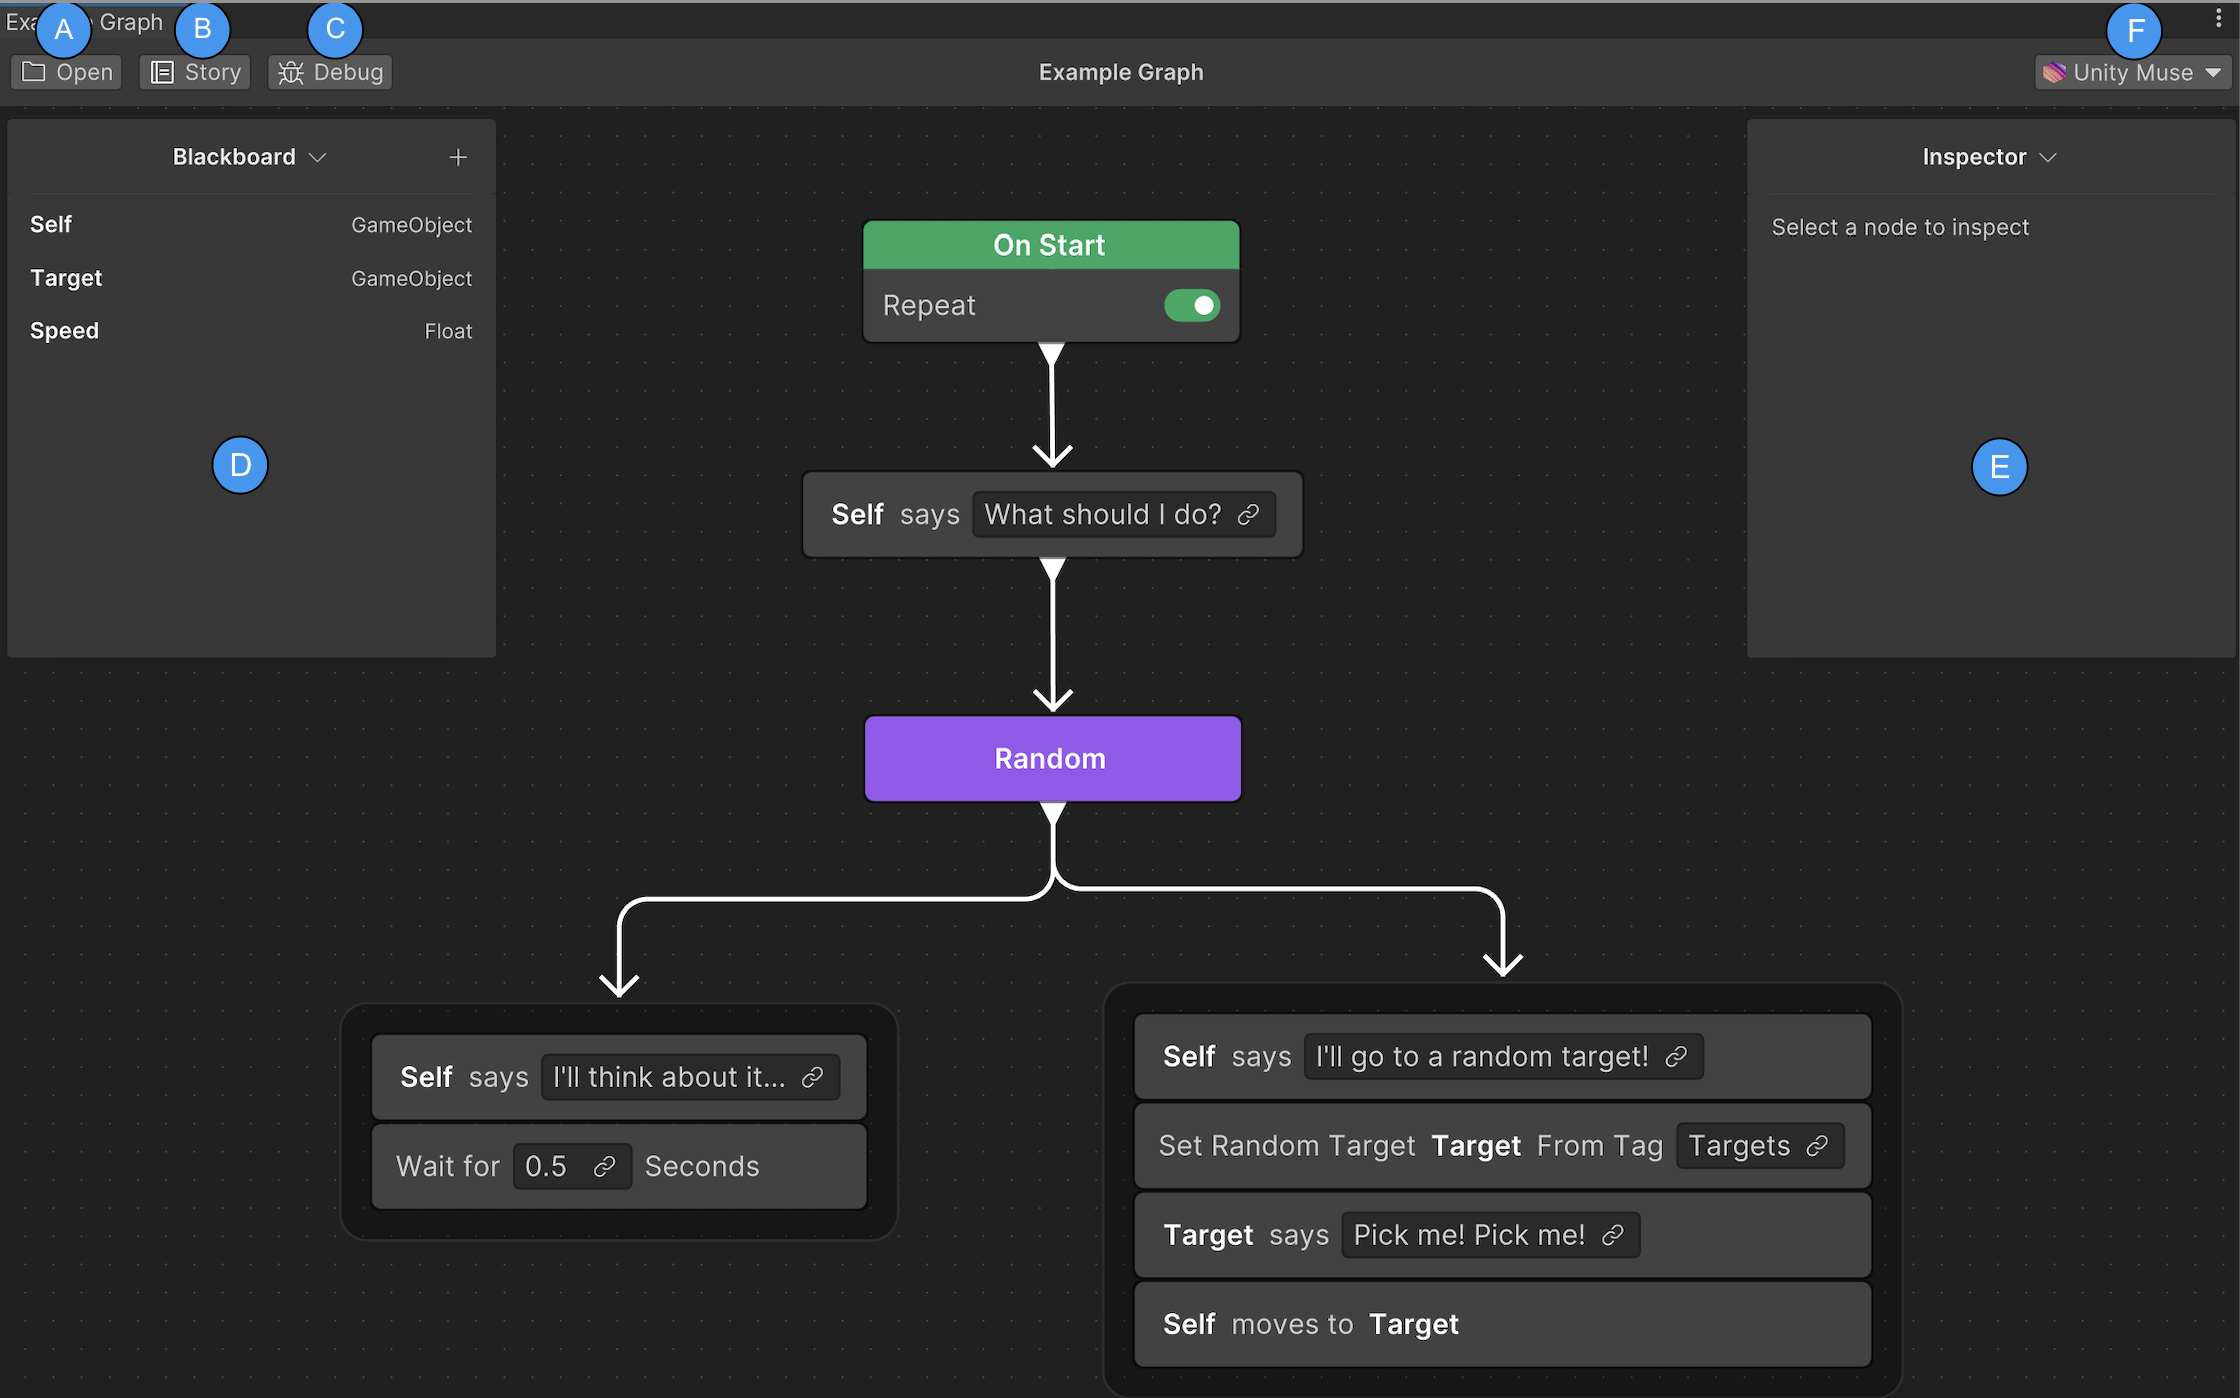
Muse Behavior editor user interface
This section provides a tour of the most common components of the Muse Behavior editor.
| Component | Description |
|---|---|
| (A) | Open provides access to the existing behavior graphs. It's found on the behavior graph editor's toolbar. |
| (B) | Story describes the behavior that the graph performs. For example, if the behavior graph shows the patrol behavior of an agent, the description of the story might be Agent patrols around waypoints. It's found on the behavior graph editor's toolbar. Note that to display a graph's story, use it as a subgraph within another behavior graph. |
| (C) | Debug helps in debugging any issues in the behavior graph. It allows you to select a GameObject for debugging and observe its behavior in real time during Play mode. The Debug option is available on the behavior graph editor's toolbar. For more information, refer to Debug the Agent in real time during Play mode. |
| (D) | Blackboard is the memory of the behavior graph. Use it to define all the variables you need to make decisions and inform your logic of the current context. You can write the required input fields that are filled at runtime. |
| (E) | Inspector provides detailed information about a node. It enables you to inspect the nodes and other elements on the behavior graph. It also allows you to view variables and set values for the selected node. |
| (F) | Unity Muse option displays the status of Muse points used and provides access to your Muse account. |