Snapshots introduction
A memory snapshot is a record of how the memory in your application was organized at the point in a frame when the snapshot was taken.

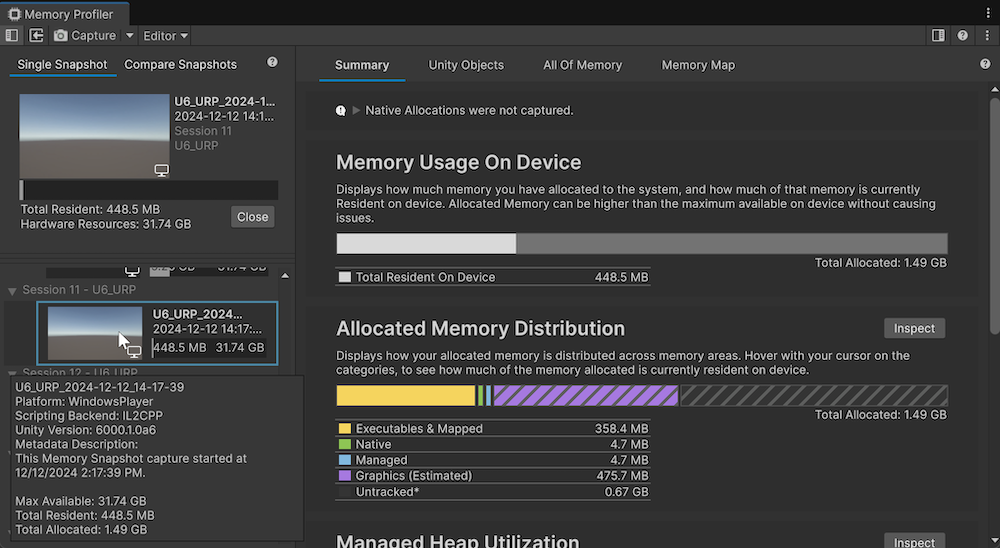
The Memory Profiler with snapshots of data in the left Snapshots panel. A selected snapshot's memory data is displayed in the Summary panel.
Use the Snapshots panel in the Memory Profiler window to capture, load, and analyze snapshots. For more information, refer to Capture and import snapshots.
You can take multiple snapshots during an application's execution but this isn't the same as constant monitoring. If you need to profile how memory use in your application changes in real-time during execution, use the Memory Profiler module in the built-in Profiler.
Snapshot files
When you create a snapshot for the first time, Unity creates a subfolder in your project folder called MemoryCaptures. By default, the Memory Profiler stores all snapshots in this folder. It saves each snapshot with the .snap extension.
Tip
Add the .snap extension to your version control system's ignore file to avoid committing memory snapshot files to your repository. Memory snapshot files might use large amounts of disk space.
To change the default storage path for the snapshots, go to Edit > Preferences > Analysis > MemoryProfiler and edit the Memory Snapshot Storage Path property.
The path in this property is relative, which means it must start with:
./if theMemoryCapturesfolder is within the Project folder../if theMemoryCapturesfolder is one level above theProjectfolder in the hierarchy.
Snapshot metadata
You can use the MetadataCollect API to add metadata to player or Editor captures. This information appears when you hover over a snapshot in the snapshot panel.
The Memory Profiler with snapshots of data in the left Snapshots panel. The tooltip for a selected snapshot displays custom metadata about the level the data was captured from.