Rendering Profiler module
The Rendering ProfilerA window that helps you to optimize your game. It shows how much time is spent in the various areas of your game. For example, it can report the percentage of time spent rendering, animating, or in your game logic. More info
See in Glossary displays rendering statistics and information about what the CPU and GPU do to render the SceneA Scene contains the environments and menus of your game. Think of each unique Scene file as a unique level. In each Scene, you place your environments, obstacles, and decorations, essentially designing and building your game in pieces. More info
See in Glossary. You can use these statistics to measure the resource intensity of different areas of the Scene, which is useful for optimization.
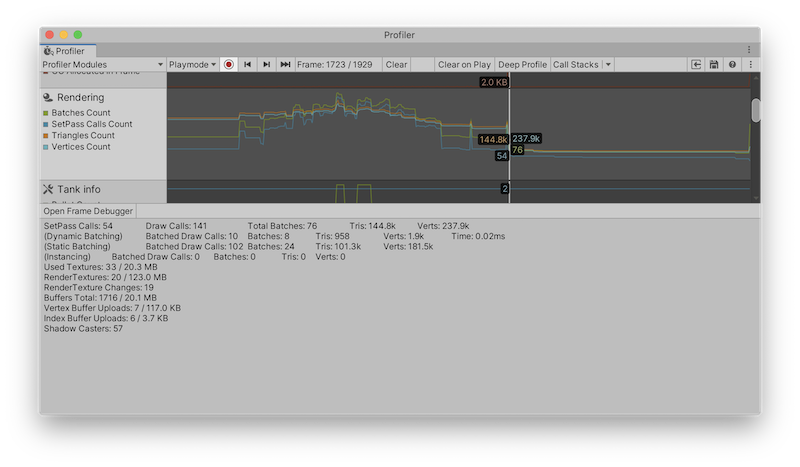
The chart displays the number of Batches, SetPass Calls, Triangles and Vertices your application rendered. The lower pane displays more rendering statistics, which match the ones shown in the GameView Rendering Statistics window.
The Rendering Profiler module’s chart is divided into four categories as follows:
| Chart | Description |
|---|---|
| Batches Count | The number of batches Unity processed during a frame. |
| SetPass Calls Count | The number of times Unity switched which shaderA program that runs on the GPU. More info See in Glossary pass it used to render GameObjectsThe fundamental object in Unity scenes, which can represent characters, props, scenery, cameras, waypoints, and more. A GameObject’s functionality is defined by the Components attached to it. More info See in Glossary during a frame. A shader might contain several shader passes and each pass renders GameObjects in the scene differently. |
| Triangles Count | The number of triangles Unity processed during a frame. |
| Vertices Count | The number of vertices Unity processed during a frame. |
Module details pane
When you click on the Rendering Profiler module, the details pane in the lower half of the window displays detailed rendering statistics. These statistics are similar to the statistics shown in the Rendering Statistics window.
In the top left of the details pane, select Open Frame Debugger to open the Frame Debugger, which gives you information on individual drawcalls that rendered the frame.
These statistics are also available via the ProfilerRecorder API and in the Profiler Module Editor so you can add them to a custom Profiler module.
| Statistic | Description | Accessible in Release Players |
|---|---|---|
| SetPass Calls Count | The number of times Unity switched which shader pass it used to render GameObjects during a frame. A shader might contain several shader passes and each pass renders GameObjects in the scene differently. | Yes |
| Draw Calls Count | The total number of draw calls Unity issued during a frame. Unity issues draw calls when it renders GameObjects to the screen. This number includes non batched draw calls as well as dynamic and static batched draw calls. | Yes |
| Total Batches Count | The total number of batches Unity processed during a frame. This number includes both static and dynamic batches. | Yes |
| Triangles Count | The number of triangles Unity processed during a frame. | Yes |
| Vertices Count | The number of vertices Unity processed during the frame. | Yes |
| (Dynamic Batching) | This section contains statistics on dynamic batchingAn automatic Unity process which attempts to render multiple meshes as if they were a single mesh for optimized graphics performance. The technique transforms all of the GameObject vertices on the CPU and groups many similar vertices together. More info See in Glossary. |
No |
| Dynamic Batched Draw Calls Count | The number of draw calls Unity combined into dynamic batches. | No |
| Dynamic Batches Count | The number of dynamic batches Unity processed during the frame. | No |
| Dynamic Batched Triangles Count | The number of triangles in the GameObjects included in the dynamic batches. | No |
| Dynamic Batched Vertices Count | The number of vertices in the GameObjects included in the dynamic batches. | No |
| Dynamic Batching Time | The time Unity spent creating dynamic batching structures. | No |
| (Static Batching) | This section contains statistics on static batchingA technique Unity uses to draw GameObjects on the screen that combines static (non-moving) GameObjects into big Meshes, and renders them in a faster way. More info See in Glossary. |
No |
| Static Batched Draw Calls Count | The number of draw calls Unity combined into static batches. | No |
| Static Batches Count | The number of static batches Unity processed during a frame. | No |
| Static Batched Triangles Count | The number of triangles in the GameObjects included in the static batches. | No |
| Static Batched Vertices Count | The number of vertices in the GameObjects included in the static batches. | No |
| (Instancing) | This section contains statistics on GPU instancing. | No |
| Instanced Batched Draw Calls Count | The number of draw calls Unity combined into instance batches. | No |
| Instanced Batches Count | The number of batches Unity processed to render instanced GameObjects during a frame. | No |
| Instanced Batched Triangles Count | The number of triangles in the instanced GameObjects. | No |
| Instanced Batched Vertices Count | The number of vertices in the instanced GameObjects. | No |
| Used Textures Count Used Textures Bytes |
The number of texturesAn image used when rendering a GameObject, Sprite, or UI element. Textures are often applied to the surface of a mesh to give it visual detail. More info See in Glossary Unity used during the frame and the amount of memory the textures used. |
No |
| Render Textures Count Render Textures Bytes |
The number of RenderTextures Unity used during the frame and the amount of memory the RenderTextures used. | Yes |
| Render TexturesA special type of Texture that is created and updated at runtime. To use them, first create a new Render Texture and designate one of your Cameras to render into it. Then you can use the Render Texture in a Material just like a regular Texture. More info See in Glossary Changes Count |
The number of times Unity set one or multiple RenderTextures as render targets during the frame. | Yes |
| Used Buffers Count Used Buffers Bytes |
The total number of GPU buffers and memory they used. This includes vertex, index and compute buffers and all internal buffers required for rendering. | Yes |
| Vertex Buffer Upload In Frame Count Vertex Buffer Upload In Frame Bytes |
The amount of geometry that the CPU uploaded to the GPU in the frame. This represents the vertex/normal/texcoord data. There might already be some geometry on the GPU. This statistic only includes geometry that Unity transfers in a frame. | Yes |
| Index Buffer Upload In Frame Count Index Buffer Upload In Frame Bytes |
The amount of geometry that the CPU uploaded to the GPU in the frame. This represents the triangle indices data. There might already be some geometry on the GPU. This statistic only includes geometry that Unity transfers in a frame. | Yes |
| Shadow Casters Count | The number of GameObjects that cast shadows in a frame. If a GameObject casts multiple shadows (because multiple lights light it), it has one entry per shadow it casts. | Yes |
Availability in Players
The Rendering module Profiler countersPlaced in code with the ProfilerCounter API to track metrics, such as the number of enemies spawned in your game. More info
See in Glossary are also available in Players. Use the ProfilerRecorder API to access Render Profiler module information in Players. High level counters are also available in Release Player.
The following example contains a simple script that collects “SetPass Calls Count”, “Draw Calls Count” and “Vertices Count” metrics and displays those as TextArea.
using System.Text;
using Unity.Profiling;
using UnityEngine;

public class RenderStatsScript : MonoBehaviour
{
    string statsText;
    ProfilerRecorder setPassCallsRecorder;
    ProfilerRecorder drawCallsRecorder;
    ProfilerRecorder verticesRecorder;

    void OnEnable()
    {
        setPassCallsRecorder = ProfilerRecorder.StartNew(ProfilerCategory.Render, "SetPass Calls Count");
        drawCallsRecorder = ProfilerRecorder.StartNew(ProfilerCategory.Render, "Draw Calls Count");
        verticesRecorder = ProfilerRecorder.StartNew(ProfilerCategory.Render, "Vertices Count");
    }

    void OnDisable()
    {
        setPassCallsRecorder.Dispose();
        drawCallsRecorder.Dispose();
        verticesRecorder.Dispose();
    }

    void Update()
    {
        var sb = new StringBuilder(500);
        if (setPassCallsRecorder.Valid)
            sb.AppendLine($"SetPass Calls: {setPassCallsRecorder.LastValue}");
        if (drawCallsRecorder.Valid)
            sb.AppendLine($"Draw Calls: {drawCallsRecorder.LastValue}");
        if (verticesRecorder.Valid)
            sb.AppendLine($"Vertices: {verticesRecorder.LastValue}");
        statsText = sb.ToString();
    }

    void OnGUI()
    {
        GUI.TextArea(new Rect(10, 30, 250, 50), statsText);
    }
}
The Rendering Profiler module information belongs to the ProfilerCategory.Render Profiler categoryIdentifies the workload data for a Unity subsystem (for example, Rendering, Scripting and Animation categories). Unity applies color-coding to categories to visually distinguish between the types of data in the Profiler window.
See in Glossary.
If you want to highlight the selected Rendering counters in a custom module, use the Module Editor to configure the chart and detailed view.