Memory Area
There are two modes in which you can inspect memory usage of your application. This is selected in the dropdown in the top of the bottom panel.
Simple View
The simple mode shows how memory is used through out unity on a higher level in realtime on a per frame basis.
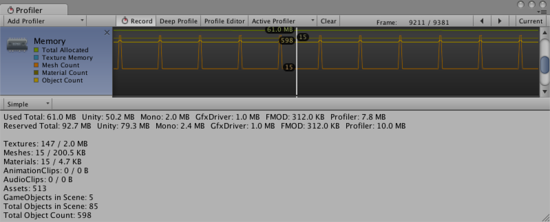
Unity reserves memory pools for allocations in order to avoid asking the os for memory too often. This is displayed as a reserved amount and how much is used. The areas covered by this is:
- Unity The amount of memory tracked by allocations in native unity code
- Mono The Total heap size and used heap size used by Managed Code - this memory is garbagecollected
- GfxDriver The estimated amount of memory the driver is using on Textures, Rendertargets, shaders and Meshdata
- FMOD The Audio drivers estimated memory usage
- Profiler Memory used for the profilerdata The numbers that are displayed are not going to show the same amount as the Task Manager or Activity Monitor, because there are some usage that is untracked by the memory profiler. This includes memory used by some drivers and memory used for Executable code.
Memory stats are shown for some of the most common asset/object types and include the count and the used memory (main and video memory)
- Textures
- Meshes
- Materials
- Animations
- Audio
- Object Count is the total number of Objects that are created. If this number rises over time then it means your game is creating some objects that are never destroyed.
Detailed View
The Detailed View, will let you take a snapshot of the current state. Use the “Take Sample” button to capture detailed memory usage. Obtaining this data takes some time, so the Detailed View should not be expected to give you real-time details. After taking a sample the profiler window will be updated with a treeview where you can explore different memory usage.
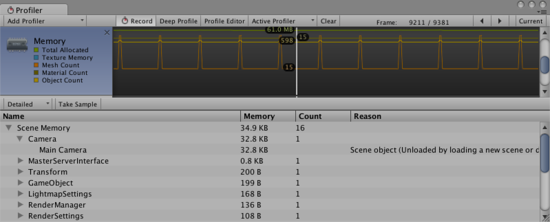
This will display individual asset and game object memory usage. It will also display a reason for an object to be in memory. The reasons can be of the following:
- Referenced from native code
- Scene object
- Built-in Resources
- Marked as don’t save
When in the editor, clicking on an object in the list, will take you to the object in either the project or the scene view.
When profiling in the editor, all numbers displayed by the memory profiler are the usage by the editor. These will be somewhat larger than when running in a player, because of editor overhead. For more precise numbers and memory usage for your app, use the profiler connection to connect to the running player. This will give the actual usage on the device.