CPU Usage Area
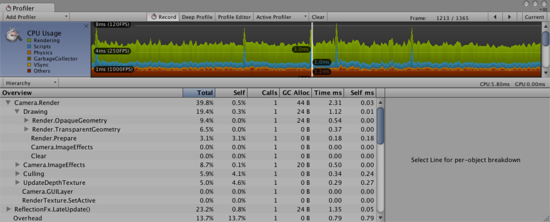
The CPU Usage area displays where time is spent in your game. When it is selected, the lower pane displays hierarchical time data for the selected frame.
- Hierarchy mode: Displays hierarchical time data.
- Group Hierarchy mode: Groups time data into logical groups (Rendering, Physics, Scripts etc.). Because children of any group can be in different group (e.g. some script might call rendering functions), the percentages of group times often add up to more than 100%. (This is not a bug.)
The way the CPU chart is stacked can be reordered by simply dragging chart labels up & down.
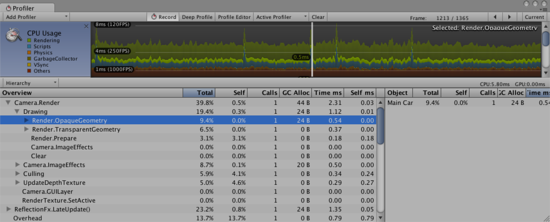
When an item is selected in the lower pane, it’s contribution to the CPU chart is highlighted (and the rest are dimmed). Clicking on an item again de-selects it.
In the hierarchical time data the self time refers to the amount of time spent in a particular function not including the time spent calling sub-functions. In the screenshot above, for example 39.8% of time is spent in the Camera.Render function. This function does a lot of work and calls the various drawing and culling functions. Excluding all these functions only 0.8% of time is spent actually in the Camera.Render function.
The Others section of the CPU profiler records the total of all areas that do not fall into Renderer, Scripts, Physics, Garbage Collection or VSync. This includes Animation, AI, Audio, Particles, Networking, Loading, and PlayerLoop.